

Observing growth and division of large numbers of individual bacteria by image analysis
- PMID: 14766541
- PMCID: PMC348858
- DOI: 10.1128/AEM.70.2.675-678.2004
Observing growth and division of large numbers of individual bacteria by image analysis
Abstract
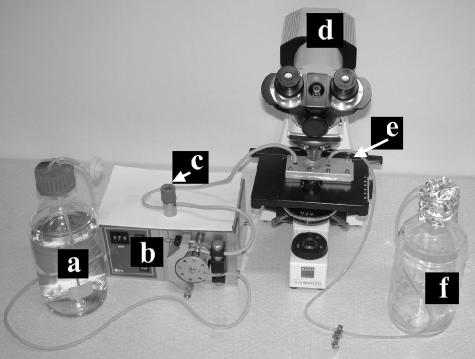
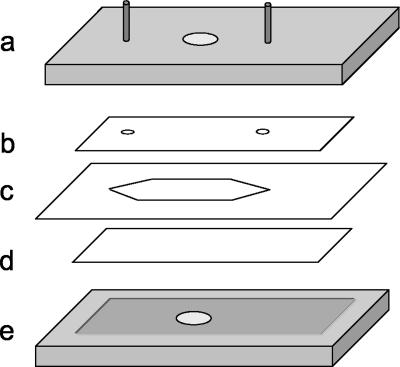
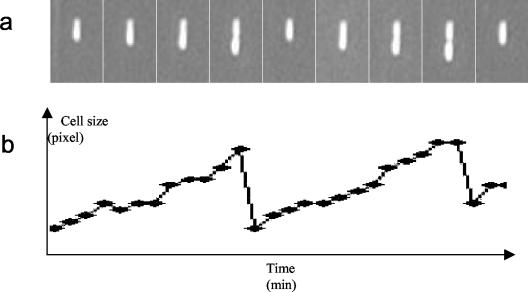
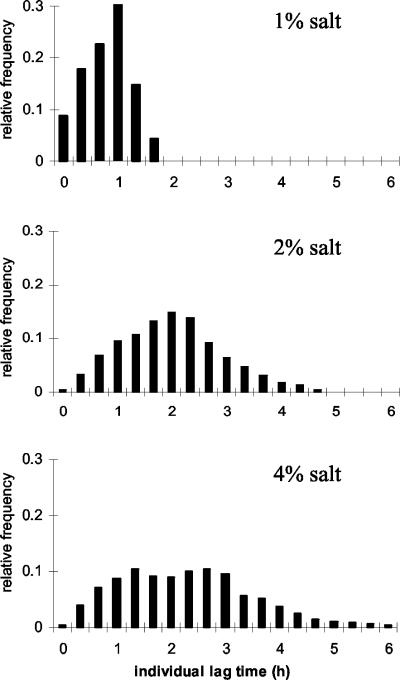
We describe a method that enabled us to observe large numbers of individual bacterial cells during a long period of cell growth and proliferation. We designed a flow chamber in which the cells attached to a transparent solid surface. The flow chamber was mounted on a microscope equipped with a digital camera. The shear force of the flow removed the daughter cells, making it possible to monitor the consecutive divisions of a single cell. In this way, kinetic parameters and their distributions, as well as some physiological characteristics of the bacteria, could be analyzed based on more than 1,000 single-cell observations. The method which we developed enabled us to study the history effect on the distribution of the lag times of single cells.
Figures
References
-
- Baranyi, J. 2002. Stochastic modelling of bacterial lag phase. Int. J. Food Microbiol. 73:203-206. - PubMed
-
- Baranyi, J., and C. Pin. 2001. A parallel study on modelling bacterial growth and survival curves. J. Theor. Biol. 210:327-336. - PubMed
-
- Berg, H. C., and S. M. Block. 1984. A miniature flow cell designed for rapid exchange of media under high-power microscope objectives. J. Gen. Microbiol. 130:2915-2920. - PubMed
-
- Caldwell, D. E., and J. R. Lawrence. 1986. Growth kinetics of Pseudomonas fluorescens microcolonies within the hydrodynamic boundary layers of surface microenvironments. Microb. Ecol. 12:299-312. - PubMed
-
- Francois, K., F. Devlieghere, A. R. Standaert, A. H. Geeraerd, J. F. M. Van Impe, and J. Debevere. 2003. Modelling the individual cell lag phase: effect of temperature and pH on the individual cell lag distribution of Listeria monocytogenes, p. 200-202. In J. F. M. Van Impe, A. H. Geeraerd, I. Leguérinel, and P. Mafart (ed.), Predictive modelling in foods—conference proceedings. KUL/BioTec, Leuven, Belgium.
Publication types
MeSH terms
LinkOut - more resources
Full Text Sources
Other Literature Sources
