. 2004 Feb;70(2):1104-15.
doi: 10.1128/AEM.70.2.1104-1115.2004.

Effect of condensed tannins on bacterial diversity and metabolic activity in the rat gastrointestinal tract

Affiliations

Effect of condensed tannins on bacterial diversity and metabolic activity in the rat gastrointestinal tract

Alexandra H Smith et al. Appl Environ Microbiol. 2004 Feb.

Abstract

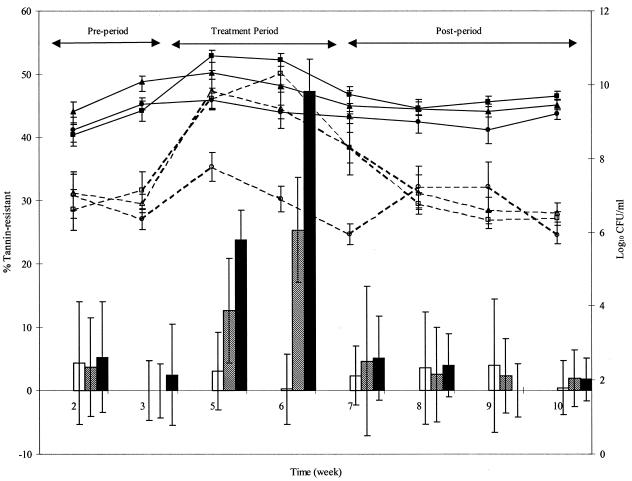
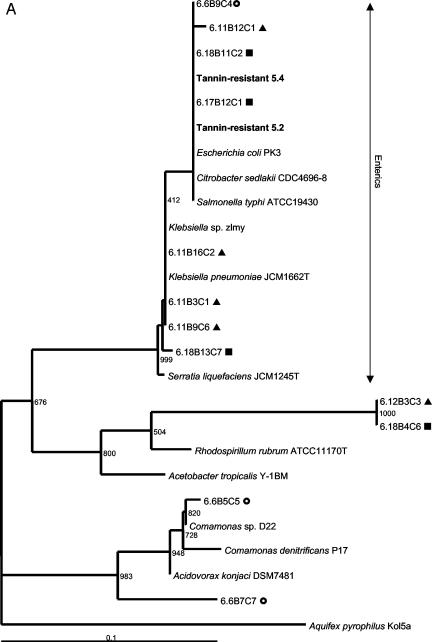
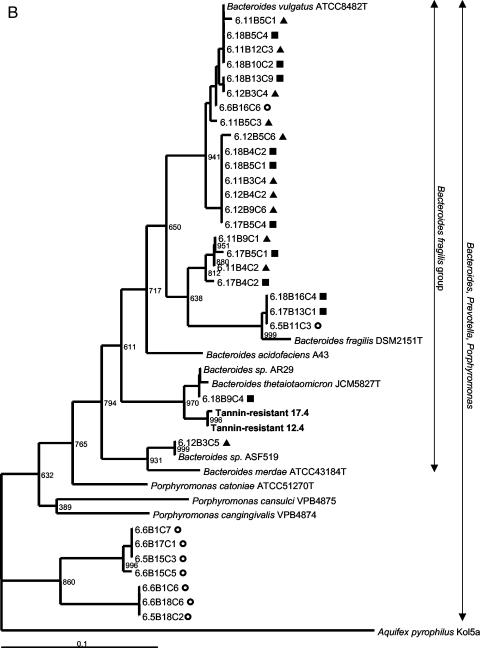
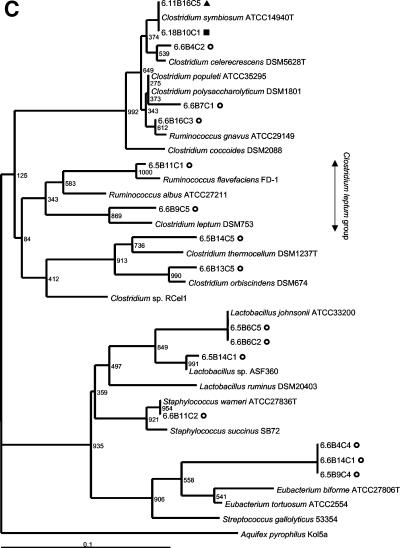
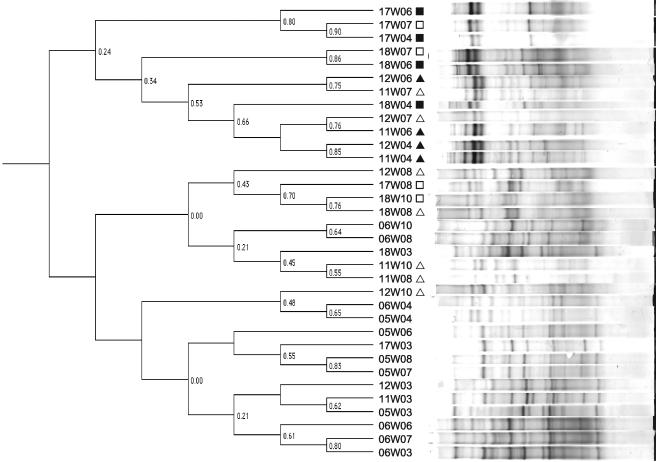
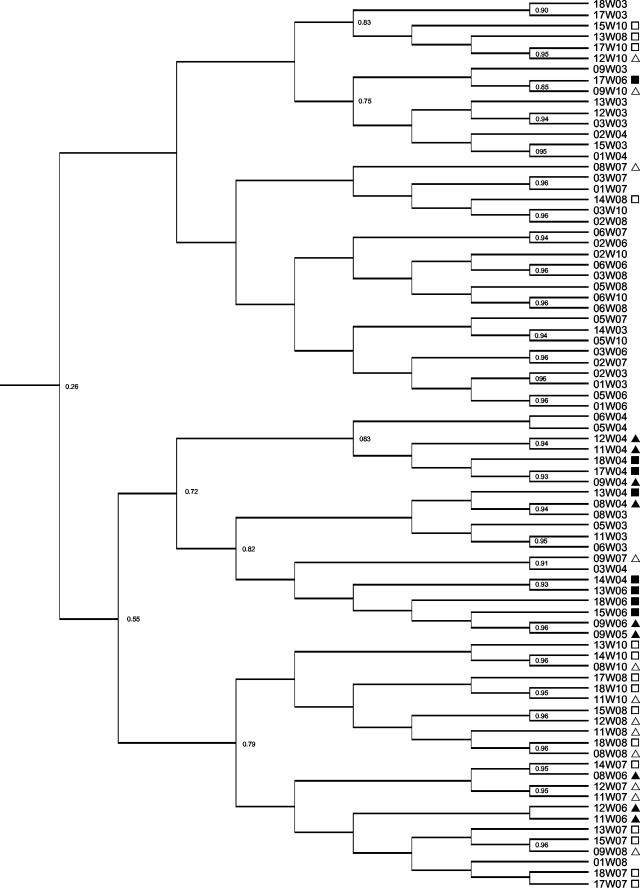
The effect of dietary condensed tannins (proanthocyanidins) on rat fecal bacterial populations was ascertained in order to determine whether the proportion on tannin-resistant bacteria increased and if there was a change in the predominant bacterial populations. After 3 weeks of tannin diets the proportion of tannin-resistant bacteria increased significantly (P < 0.05) from 0.3% +/- 5.5% to 25.3% +/- 8.3% with a 0.7% tannin diet and to 47.2% +/- 5.1% with a 2% tannin diet. The proportion of tannin-resistant bacteria returned to preexposure levels in the absence of dietary tannins. A shift in bacterial populations was confirmed by molecular fingerprinting of fecal bacterial populations by denaturing gradient gel electrophoresis (DGGE). Posttreatment samples were generally still distinguishable from controls after 3.5 weeks. Sequence analysis of DGGE bands and characterization of tannin-resistant isolates indicated that tannins selected for Enterobacteriaceae and Bacteroides species. Dot blot quantification confirmed that these gram-negative bacterial groups predominated in the presence of dietary tannins and that there was a corresponding decrease in the gram-positive Clostridium leptum group and other groups. Metabolic fingerprint patterns revealed that functional activities of culturable fecal bacteria were affected by the presence of tannins. Condensed tannins of Acacia angustissima altered fecal bacterial populations in the rat gastrointestinal tract, resulting in a shift in the predominant bacteria towards tannin-resistant gram-negative Enterobacteriaceae and Bacteroides species.


Figures

FIG. 1.
FIG. 1.
Counts (log10 CFU per milliliter) of total fecal bacteria (solid lines) and tannin-resistant fecal bacteria (dashed lines) and proportion of tannin-resistant fecal bacteria (bars) during the pretreatment period, the treatment period, and the posttreatment period for rats fed diets containing no tannin (circles and open bars), a low level of tannins (triangles and bars with diagonal lines), and a high level of tannins (squares and solid bars); the tannins used were A. angustissima condensed tannins. The error bars indicate standard deviations.
FIG. 2.
FIG. 2.
Phylogenetic placement of V3 16S rRNA gene sequences of rat fecal bacteria excised from predominant DGGE bands in the Proteobacteria (A), the Bacteroides class (B), and the Firmicutes (C). Rats were fed a control diet (○) or a diet containing a low level (▴) or a high level (▪) of A. angustissima tannin. Bacteria isolated from tannin-containing plates are indicated by boldface type. Bacteria detectable with the probes used for the dot blot hybridization study are indicated with vertical arrows. Bootstrap resampling values based on 1,000 replicates are indicated at the nodes of the tree. Aquifex pyrophilus was used as the outgroup for rooting the trees. Scale bar = 1 fixed nucleotide position per sequence.
FIG. 2.
FIG. 2.
Phylogenetic placement of V3 16S rRNA gene sequences of rat fecal bacteria excised from predominant DGGE bands in the Proteobacteria (A), the Bacteroides class (B), and the Firmicutes (C). Rats were fed a control diet (○) or a diet containing a low level (▴) or a high level (▪) of A. angustissima tannin. Bacteria isolated from tannin-containing plates are indicated by boldface type. Bacteria detectable with the probes used for the dot blot hybridization study are indicated with vertical arrows. Bootstrap resampling values based on 1,000 replicates are indicated at the nodes of the tree. Aquifex pyrophilus was used as the outgroup for rooting the trees. Scale bar = 1 fixed nucleotide position per sequence.
FIG. 3.
FIG. 3.
Relationships of PCR-amplified V3 16S rRNA gene fragment banding patterns from rat fecal genomic DNA from six animals (two for each treatment) obtained at week 3 (pretreatment), weeks 4 and 6 (treatment period), and weeks 7, 8, and 10 (posttreatment). Rats were fed a control diet (no symbol) or a diet that contained a low level (triangles) or a high level (squares) of A. angustissima condensed tannin. Patterns that were obtained posttreatment are indicated by open symbols. Similarity indices (Dice coefficients) are indicated at the nodes of the tree (Ward's).
FIG. 4.
FIG. 4.
Relationships of metabolic fingerprint patterns generated after rat fecal incubation for week 3 (pretreatment), weeks 4 and 6 (treatment period), and weeks 7, 8, and 10 (posttreatment). Rats were fed a control diet (no symbol) or a diet containing a low level (triangles) or a high level of (squares) of A. angustissima condensed tannin. Patterns that were obtained posttreatment are indicated by open symbols. Similarity indices (Dice coefficients) are indicated at the nodes of the tree (Ward's).

References

    1. Aiyar, A. 2000. The use of CLUSTAL W and CLUSTAL X for multiple sequence alignment. Methods Mol. Biol. 132:221-241. - PubMed
    1. Altschul, S. F., W. Gish, W. Miller, E. W. Myers, and D. J. Lipman. 1990. Basic local alignment search tool. J. Mol. Biol. 215:403-410. - PubMed
    1. Amann, R. I., B. J. Binder, R. J. Olson, S. W. Chisholm, R. Devereux, and D. A. Stahl. 1990. Combination of 16S rRNA-targeted oligonucleotide probes with flow cytometry for analyzing mixed microbial populations. Appl. Environ. Microbiol. 56:1919-1925. - PMC - PubMed
    1. Balmer, S. E., and B. A. Wharton. 1991. Diet and faecal flora in the newborn: iron. Arch. Dis. Child. 66:1390-1394. - PMC - PubMed
    1. Benoni, G., L. Cuzzolin, D. Zambreri, M. Donini, P. Del Soldato, and I. Caramazza. 1993. Gastrointestinal effects of single and repeated doses of ferrous sulphate in rats. Pharmacol. Res. 27:73-80. - PubMed

Publication types

MeSH terms

Associated data

LinkOut - more resources