

Second generation Tibetan lowlanders acclimatize to high altitude more quickly than Caucasians
- PMID: 14766936
- PMCID: PMC1664949
- DOI: 10.1113/jphysiol.2003.059188
Second generation Tibetan lowlanders acclimatize to high altitude more quickly than Caucasians
Abstract
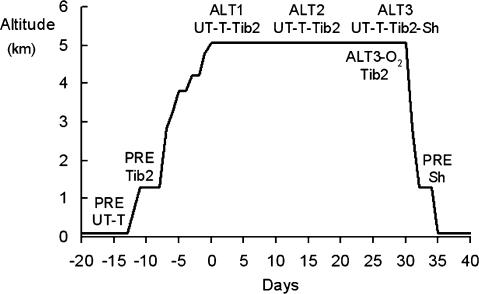
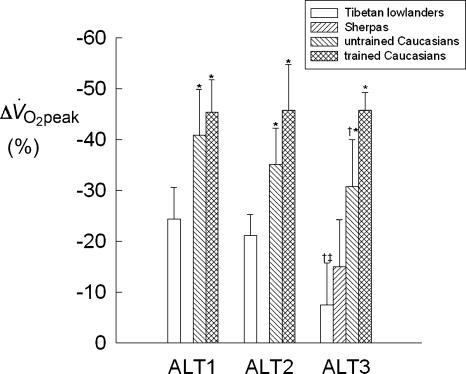
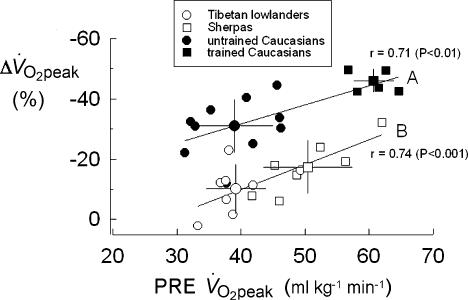
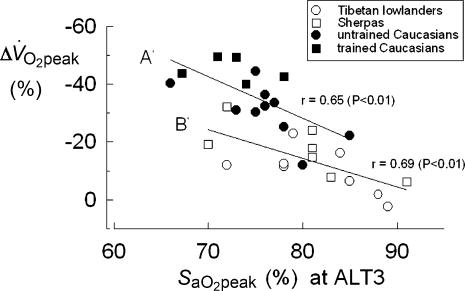
Tibetan highlanders develop at altitude peak aerobic power levels close to those of Caucasians at sea level. In order to establish whether this feature is genetic and, as a consequence, retained by Tibetan lowlanders, altitude-induced changes of peak aerobic performance were assessed in four groups of volunteers with different ethnic, altitude exposure and fitness characteristics, i.e. eight untrained second-generation Tibetans (Tib 2) born and living at 1300 m; seven altitude Sherpas living at approximately 2800-3500 m; and 10 untrained and five trained Caucasians. Measurements were carried out at sea level or at Kathmandu (1300 m, Nepal) (PRE), and after 2-4 (ALT1), 14-16 (ALT2), and 26-28 (ALT3) days at 5050 m. At ALT3, of untrained and trained Caucasians was -31% and -46%, respectively. By contrast, of Tib 2 and Sherpas was -8% and -15%, respectively. At ALT3, peak heart rate (HR(peak)) of untrained and trained Caucasians was 148 +/- 11 and 149 +/- 7 beats min(-1), respectively; blood oxygen saturation at peak exercise was 76 +/- 6% and 73 +/- 6%, and haemoglobin concentration ([Hb]) was 19.4 +/- 1.0 and 18.6 +/- 1.2 g dl(-1), respectively. Compared to Caucasians, Tib 2 and Sherpas exhibited at ALT3 higher HR(peak) (179 +/- 9 and 171 +/- 4 beats min(-1), P < 0.001), lower [Hb] (16.6 +/- 0.6 and 17.4 +/- 0.9 g dl(-1), respectively, P < 0.001), and slightly but non-significantly greater average values (82 +/- 6 and 80 +/- 7%). The above findings and the time course of adjustment of the investigated variables suggest that Tibetan lowlanders acclimatize to chronic hypoxia more quickly than Caucasians, independent of the degree of fitness of the latter.
Figures
References
-
- Anholm JD, Milne ENC, Stark P, Bourne JC, Friedman P. Radiographic evidence of interstitial pulmonary edema after exercise at altitude. J Appl Physiol. 1999;86:503–509. - PubMed
-
- Beall CM. Adaptations to altitude: a current assessment. Ann Rev Anthropol. 2001;30:423–456.
-
- Beall CM, Brittenham GM, Strohl KP, Blangero J, Williams-Blangero S, Goldstein MC, Decker MJ, Vargas E, Villena M, Soria R, Alarcon AM, Gonzales C. Hemoglobin concentration of high-altitude Tibetans and Bolivian Aymara. Am J Phys Anthropol. 1998;106:385–400. - PubMed
-
- Bogaard HJ, Hopkins SR, Yamaya Y, Niizeki K, Ziegler MG, Wagner PD. Role of autonomic nervous system in the reduced maximal cardiac output at altitude. J Appl Physiol. 2002;93:271–279. - PubMed
-
- Boushel R, Calbet JAL, Rådegran G, Søndergaard H, Wagner PD, Saltin B. Parasympathetic neural activity accounts for the lowering of exercise heart rate at high altitude. Circulation. 2001;104:1785–1791. - PubMed
Publication types
MeSH terms
Substances
LinkOut - more resources
Full Text Sources
Miscellaneous