

Darwin's abominable mystery: Insights from a supertree of the angiosperms
- PMID: 14766971
- PMCID: PMC357025
- DOI: 10.1073/pnas.0308127100
Darwin's abominable mystery: Insights from a supertree of the angiosperms
Abstract
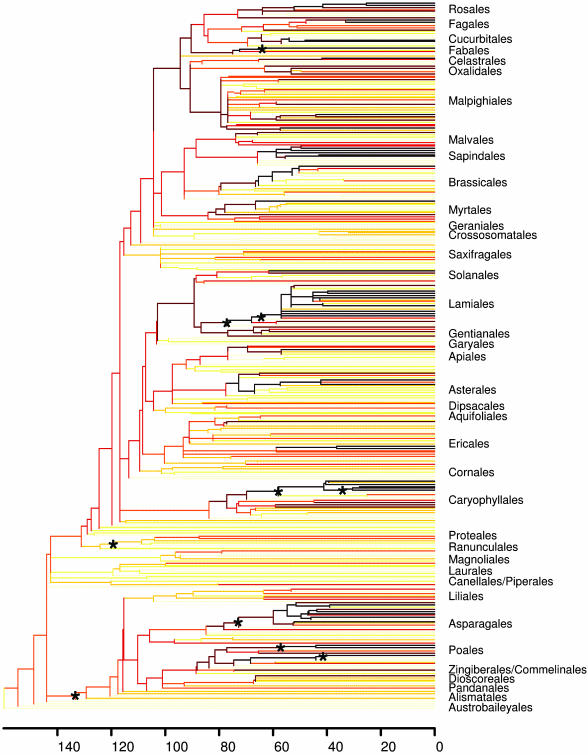
Angiosperms are among the major terrestrial radiations of life and a model group for studying patterns and processes of diversification. As a tool for future comparative studies, we compiled a supertree of angiosperm families from published phylogenetic studies. Sequence data from the plastid rbcL gene were used to estimate relative timing of branching events, calibrated by using robust fossil dates. The frequency of shifts in diversification rate is largely constant among time windows but with an apparent increase in diversification rates within the more recent time frames. Analyses of species numbers among families revealed that diversification rate is a labile attribute of lineages at all levels of the tree. An examination of the top 10 major shifts in diversification rates indicates they cannot easily be attributed to the action of a few key innovations but instead are consistent with a more complex process of diversification, reflecting the interactive effects of biological traits and the environment.
Figures
References
-
- Darwin, F. & Seward, A. C., eds. (1903) More Letters of Charles Darwin (John Murray, London), Vol. 2.
-
- Crane, P. R., Friis, E. M. & Pedersen, K. J. (1995) Nature 374, 27–33.
-
- Barrett, P. M. & Willis, K. J. (2001) Biol. Rev. 76, 411–447. - PubMed
-
- Wilson, E. O. (1992) The Diversity of Life (Belknap, Harvard Univ. Press, Cambridge, MA).
Publication types
MeSH terms
LinkOut - more resources
Full Text Sources
Other Literature Sources
Research Materials
