. 2004 Feb 17;101(7):1840-5.
doi: 10.1073/pnas.0303950101. Epub 2004 Feb 6.

The glyceryl ester of prostaglandin E2 mobilizes calcium and activates signal transduction in RAW264.7 cells

Affiliations

The glyceryl ester of prostaglandin E2 mobilizes calcium and activates signal transduction in RAW264.7 cells

Chaitanya S Nirodi et al. Proc Natl Acad Sci U S A. .

Abstract

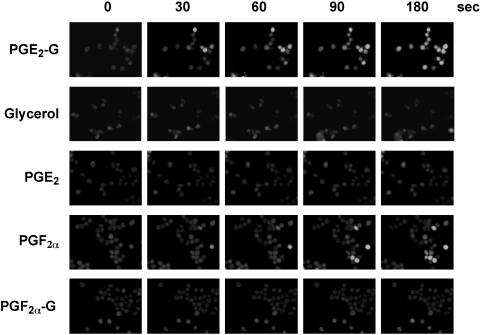
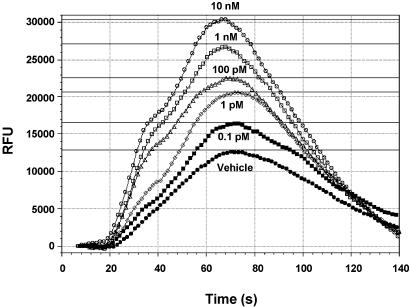
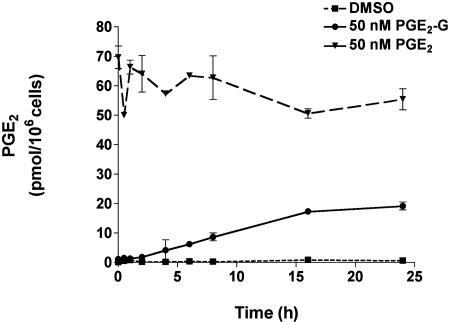
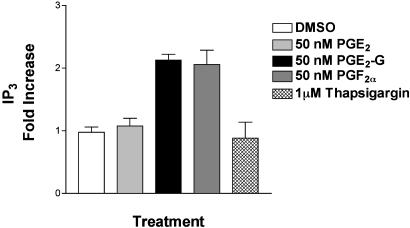
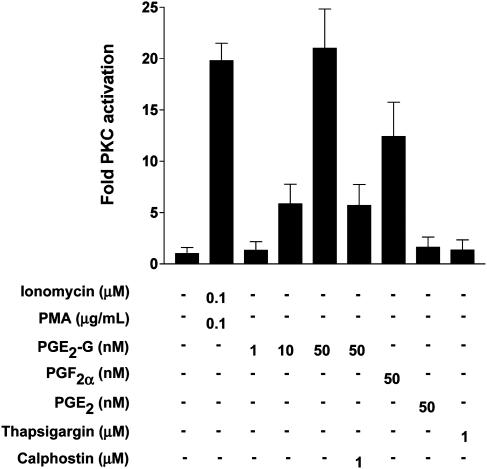
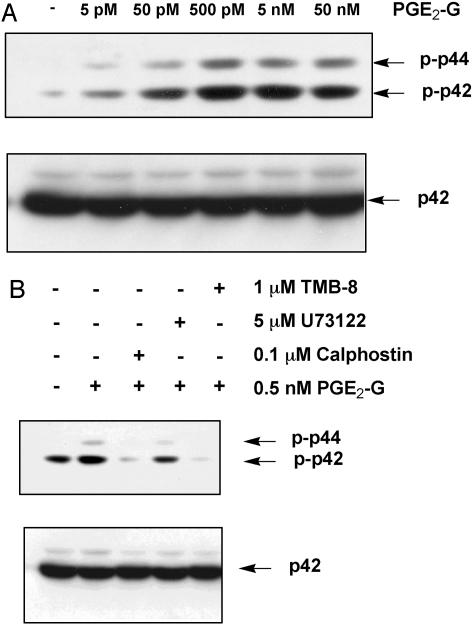
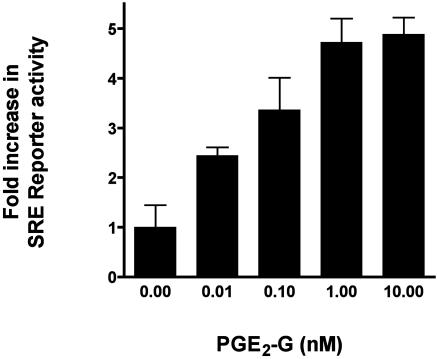
Glyceryl prostaglandins (PG-Gs) are generated by the oxygenation of the endocannabinoid, 2-arachidonylglycerol, by cyclooxygenase 2. The biological consequences of this selective oxygenation are uncertain because the cellular activities of PG-Gs have yet to be defined. We report that the glyceryl ester of PGE(2), PGE(2)-G, triggers rapid, concentration-dependent Ca(2+) accumulation in a murine macrophage-like cell line, RAW264.7. Ca(2+) mobilization is not observed after addition of PGE(2), PGD(2)-G, or PGF(2alpha)-G but is observed after addition of PGF(2alpha). Moreover, PGE(2)-G, but not PGE(2), stimulates a rapid but transient increase in the levels of inositol 1,4,5-trisphosphate (IP(3)) as well as the membrane association and activation of PKC. PGE(2)-G induces a concentration-dependent increase in the levels of phosphorylated extracellular signal regulated kinases 1 and 2 through a pathway that requires the activities of PKC, IP(3) receptor, and phospholipase C beta. The results indicate that PGE(2)-G triggers Ca(2+) mobilization, IP(3) synthesis, and activation of PKC in RAW264.7 macrophage cells at low concentrations. These responses are independent of the hydrolysis of PGE(2)-G to PGE(2).


Figures

Fig. 1.
Fig. 1.
PGE2-G induces Ca2+ mobilization in RAW264.7 cells. RAW264.7 cells were loaded with 0.5 μM Fluo-4-AM and transferred to Tyrode's solution containing 2.5 mM probenecid, as described in Experimental Procedures. The cells were then treated with 50 nM glycerol, PGE2-G, PGE2, PGF2α, or PGF2α-G, and images were acquired at the indicated times. The experiment was performed three times in duplicate. The data presented are from a typical experiment.
Fig. 2.
Fig. 2.
PGE2-G induces a concentration-dependent release of Ca2+. RAW264.7 cells were loaded with Calcium 3 reagent in the presence of 2.5 mM probenecid, as described in Experimental Procedures. PGE2-G in the concentration range of 0.1 pM to 10 μM was applied robotically at 20 s, and fluorescence was measured at 1.52-s intervals over a 3-min period. Samples were excited at 488 nm, and emission spectra were recorded at 525 nm by using softmax pro v.2. The experiment was performed at least three times with multiple replicates. The data shown are from a typical experiment. RFU, relative fluorescence units.
Fig. 3.
Fig. 3.
PGE2-G is not converted to PGE2 in cultures of RAW264.7 cells. RAW264.7 cells were treated with DMSO (dashed line), 50 nM PGE2-G (solid line), or 50 nM PGE2 (broken line). Medium was withdrawn at different time points, and PGE2 in the medium was quantified by GC/MS as described (5). Values obtained with vehicle control represented basal PGE2 levels. Sample treatments from a single experiment performed in triplicate are plotted as pmol of PGE2 per 106 cells vs. time. Error bars represent standard deviation in samples from a single experiment performed in triplicate. The experiment was performed twice with similar results.
Fig. 4.
Fig. 4.
PGE2-G increases the levels of inositol 1,4,5-trisphosphate (IP3). IP3 levels in lysates of cells treated with 50 nM PGE2-G, 50 nM PGE2, 50 nM PGF2α, or 1 μM thapsigargin were measured. Results from a typical experiment are shown. Error bars represent standard deviation in triplicate samples of a single experiment.
Fig. 5.
Fig. 5.
PGE2-G induces the activity of PKC in RAW264.7 membrane fractions. RAW264.7 cells were treated for 5 min with vehicle, 0.1 μM ionomycin/0.1 μg/ml PMA, 1, 10, or 50 nM PGE2-G, 50 nM PGF2α, 50 nM PGE2, or 1 μM thapsigargin. Cells were lysed, and PKC activity in membrane fractions was measured as described in Experimental Procedures. The experiment was performed at least five times in duplicate. Results shown are from a typical experiment. Error bars represent the range in duplicate samples of a single experiment.
Fig. 6.
Fig. 6.
PGE2-G induces the activity of ERK in a PKC-dependent manner. RAW264.7 cells were treated for 15 min with vehicle or the indicated concentrations of PGE2-G. Equal amounts (30 μg) of lysate were resolved by SDS/PAGE on 8% gels, and the protein was transferred to poly(vinylidene difluoride) membranes. Membranes were processed for Western blot analysis with an antibody that recognized the phosphorylated forms of p44 (ERK1) and p42 (ERK2) (Upper). Membranes were stripped and reprobed with an antibody that bound modified and unmodified forms of p42. Arrows indicate relative mobility of phospho-p42 and phospho-p44 or p42. (A) Cells received PGE2-G within a concentration range of 5 pM to 50 nM. (B) Cells were pretreated for 15 min with 0.1 μM calphostin, 5 μM U73122, or 1 μM TMB-8 before a 15-min incubation with 0.5 nM PGE2-G. The results shown are from a typical experiment.
Fig. 7.
Fig. 7.
PGE2-G induces SRE.Luciferase reporter expression in a concentration-dependent manner. RAW264.7 cells were transfected with 0.2 μg each of SRE.Luciferase and CMV.Renilla luciferase constructs, grown for 48 h in serum-free medium, and treated with indicated concentrations of PGE2-G for 5 h. Relative luciferase activity from lysates was measured and plotted as a function of agonist concentration. Shown is a representative of three independent experiments performed in triplicate. Error bars represent standard deviations obtained from triplicate values from a single experiment.

References

    1. Smith, W. L. (1992) Am. J. Physiol. 263, F181–F191. - PubMed
    1. Yu, M., Ives, D. & Ramesha, C. S. (1997) J. Biol. Chem. 272, 21181–21186. - PubMed
    1. Kozak, K. R., Rowlinson, S. W. & Marnett, L. J. (2000) J. Biol. Chem. 275, 33744–33749. - PubMed
    1. Kozak, K. R., Crews, B. C., Morrow, J. D., Wang, L. H., Ma, Y. H., Weinander, R., Jakobsson, P. J. & Marnett, L. J. (2002) J. Biol. Chem. 277, 44877–44885. - PubMed
    1. Coffey, R. J., Hawkey, C. J., Damstrup, L., Graves-Deal, R., Daniel, V. C., Dempsey, P. J., Chinery, R., Kirkland, S. C., DuBois, R. N., Jetton, T. L. & Morrow, J. D. (1997) Proc. Natl. Acad. Sci. USA 94, 657–662. - PMC - PubMed

Publication types

MeSH terms