. 2004 Feb 17;101(7):2167-72.
doi: 10.1073/pnas.0305697101. Epub 2004 Feb 6.

A revised view of sensory cortical parcellation

Affiliations

A revised view of sensory cortical parcellation

Mark T Wallace et al. Proc Natl Acad Sci U S A. .

Abstract

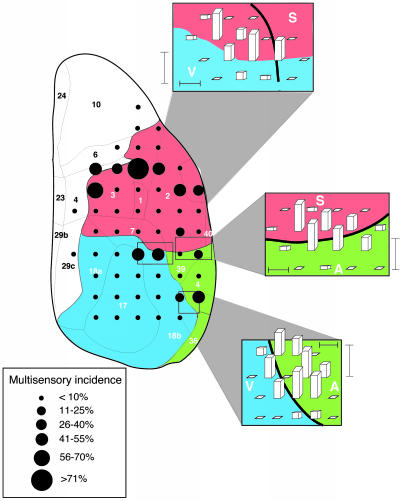
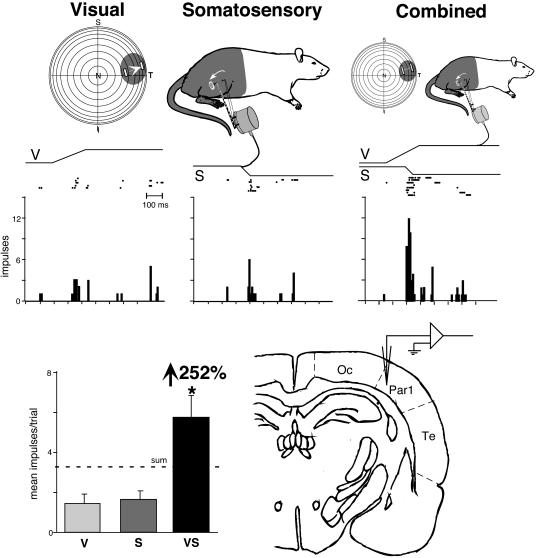
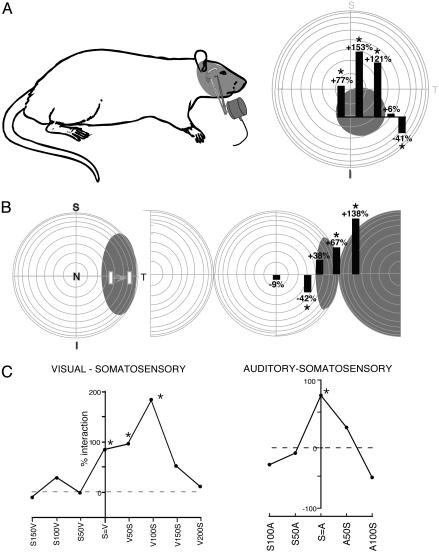
Traditional cortical parcellation schemes have emphasized the presence of sharply defined visual, auditory, and somatosensory domains populated exclusively by modality-specific neurons (i.e., neurons responsive to sensory stimuli from a single sensory modality). However, the modality-exclusivity of this scheme has recently been challenged. Observations in a variety of species suggest that each of these domains is subject to influences from other senses. Using the cerebral cortex of the rat as a model, the present study systematically examined the capability of individual neurons in visual, auditory, and somatosensory cortex to be activated by stimuli from other senses. Within the major modality-specific domains, the incidence of inappropriate (i.e., nonmatching) and/or multisensory neurons was very low. However, at the borders between each of these domains a concentration of multisensory neurons was found whose modality profile matched the representations in neighboring cortices and that were able to integrate their cross-modal inputs to give rise to enhanced and/or depressed responses. The results of these studies are consistent with some features of both the traditional and challenging views of cortical organization, and they suggest a parcellation scheme in which modality-specific cortical domains are separated from one another by transitional multisensory zones.


Figures

Fig. 1.
Fig. 1.
The distribution of multisensory neurons in rat sensory neocortex. The line drawing depicts the dorsal surface of cortex. Numbers and solid lines designate major subdivisions (17) (parietal, red shading; temporal, green shading; and occipital, blue shading). Filled circles show locations of electrode penetrations in a coarse-grain analysis that was conducted in 22 animals, and circle size indicates the relative incidence of multisensory neurons at each site. Insets show the results of higher-resolution sampling through each of the transitional regions that was conducted in a total of nine animals. Bar height indicates the relative incidence of multisensory neurons. Horizontal scale bar = 250 μm, and vertical scale bar = 50% multisensory incidence. V, visual cortex; A, auditory cortex; S, somatosensory cortex.
Fig. 2.
Fig. 2.
Receptive field overlap and multisensory enhancement in a visual-somatosensory neuron recorded at the occipital/parietal border. (Top) Visual and somatosensory receptive fields (shading) and locations of stimuli (icons depict stimulus movement) used in sensory testing. (Middle) Rasters and peristimulus time histograms illustrate responses to the visual, somatosensory, and combined visual-somatosensory stimulation. (Bottom Left) Summary bar graph illustrates the modality-specific [i.e., visual (V) and somatosensory (S)] and multisensory (i.e., VS) responses and the proportionate gain seen for the multisensory combination. (Bottom Right) The location of this neuron at the occipital/parietal border is shown on this drawing of a coronal section. *, P < 0.01. N, nasal; T, temporal; S, superior; I, inferior; Oc, occipital; Par1, parietal 1; Te, temporal.
Fig. 3.
Fig. 3.
Spatial and temporal stimulus relationships influence multisensory integration. (A) The visual and somatosensory receptive fields of this neuron are shown by the shading. In this spatial manipulation, the somatosensory stimulus was always on the face (icon of probe), whereas the visual stimulus was presented at multiple locations within and outside its receptive field. Visual stimulus location is depicted along the abscissa of the bar graphs. Each bar shows the sign and magnitude of the resultant multisensory interaction. Note the significant response enhancements when both stimuli were presented within their receptive fields and the response depression when the visual stimulus was presented outside its receptive field. (B) The visual and auditory receptive fields of this neuron are shown in shading. In this example, the location of the visual stimulus was held constant, while the location of the auditory stimulus was varied. Again, note the response enhancement for within-receptive field pairings and the response depression when the auditory stimulus was moved just outside of its receptive field. (C) Two examples of the impact of changing stimulus timing on multisensory integration. Note that whereas the neuron shown in Left exhibited significant enhancements over a range of stimulus-onset asynchronies (e.g., V50S means the visual stimulus preceded the somatosensory stimulus by 50 ms) spanning 100 ms, the neuron shown in Right exhibited enhancements only when the stimuli were presented simultaneously (S=A). *, P < 0.05.

References

    1. Stein, B. E. & Meredith, M. A. (1993) The Merging of the Senses (MIT Press, Cambridge, MA).
    1. Meredith, M. A. & Stein, B. E. (1983) Science 221, 389-391. - PubMed
    1. Meredith, M. A. & Stein, B. E. (1986) J. Neurophysiol. 56, 640-662. - PubMed
    1. Wallace, M. T., Wilkinson, L. K. & Stein, B. E. (1996) J. Neurophysiol. 76, 1246-1266. - PubMed
    1. Stein, B. E., Huneycutt, W. S. & Meredith, M. A. (1988) Brain Res. 448, 355-358. - PubMed

Publication types

LinkOut - more resources