Comparative Study
. 2004 Mar;123(3):191-204.
doi: 10.1085/jgp.200308966. Epub 2004 Feb 9.

Regulated exocytosis of GABA-containing synaptic-like microvesicles in pancreatic beta-cells

Affiliations
Comparative Study

Regulated exocytosis of GABA-containing synaptic-like microvesicles in pancreatic beta-cells

Matthias Braun et al. J Gen Physiol. 2004 Mar.

Abstract

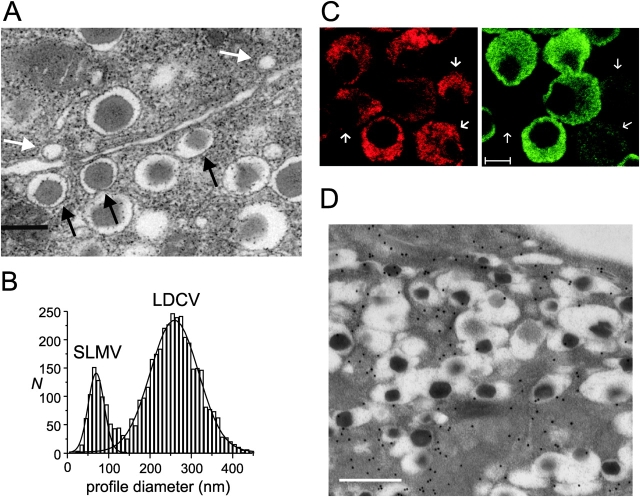
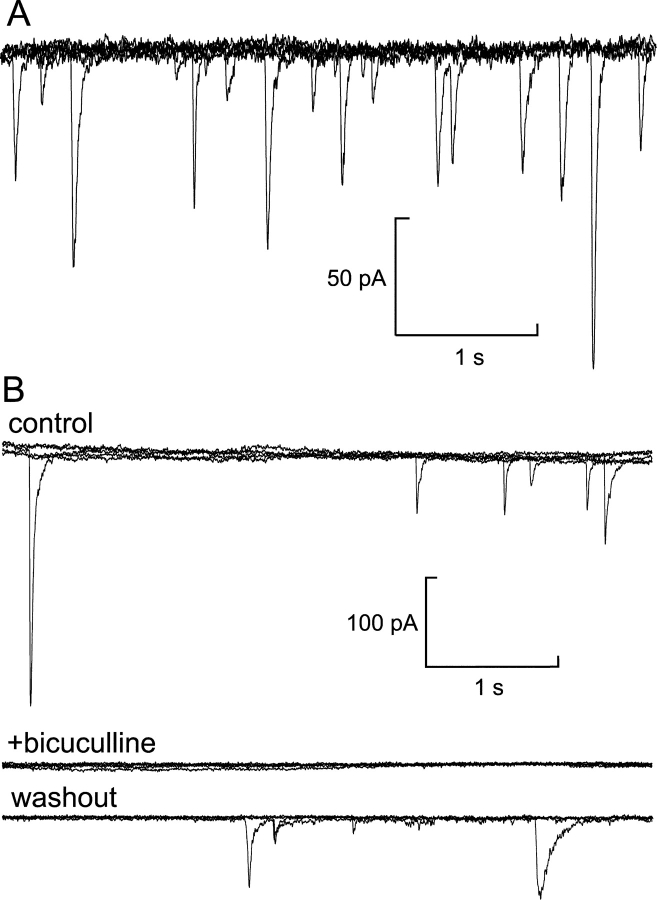
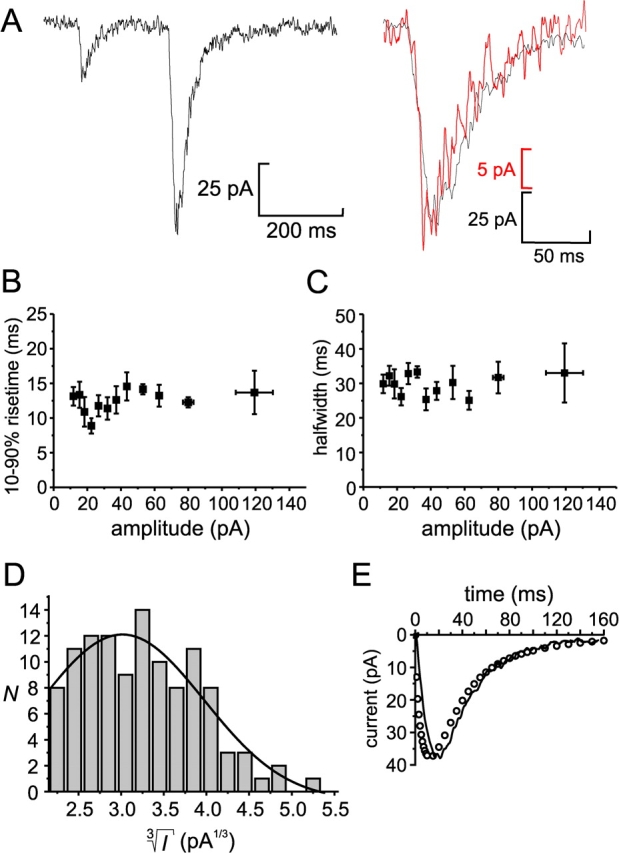
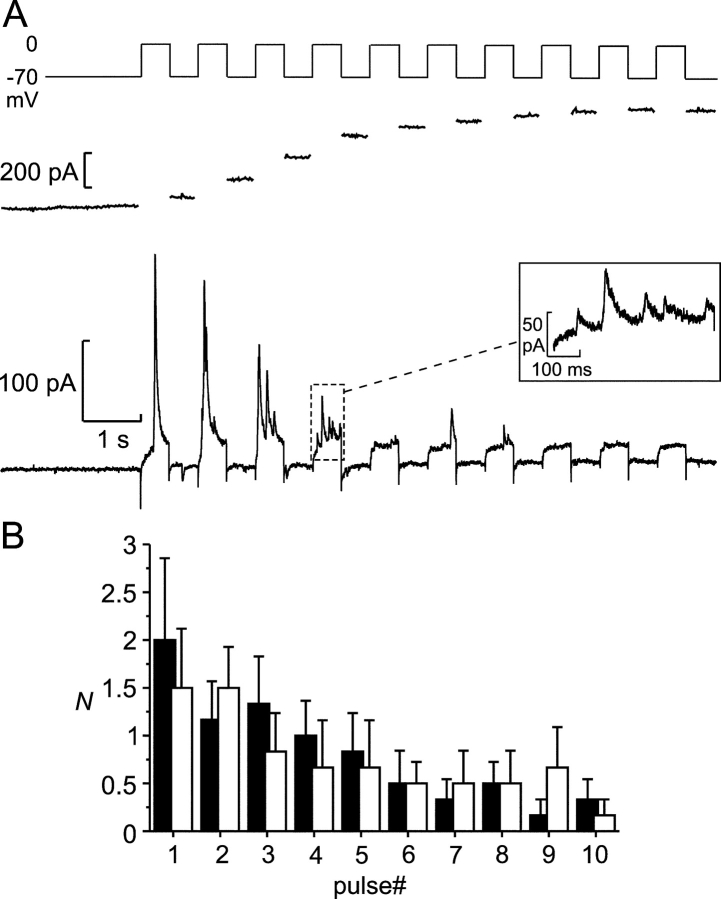
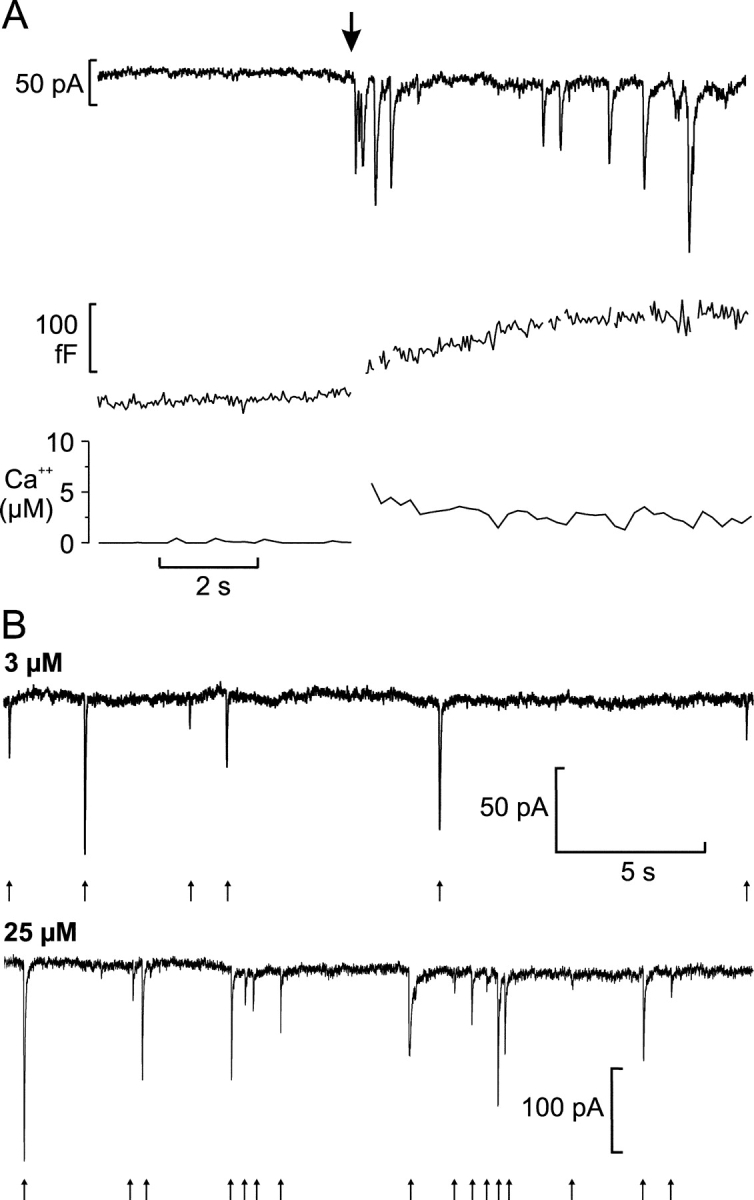
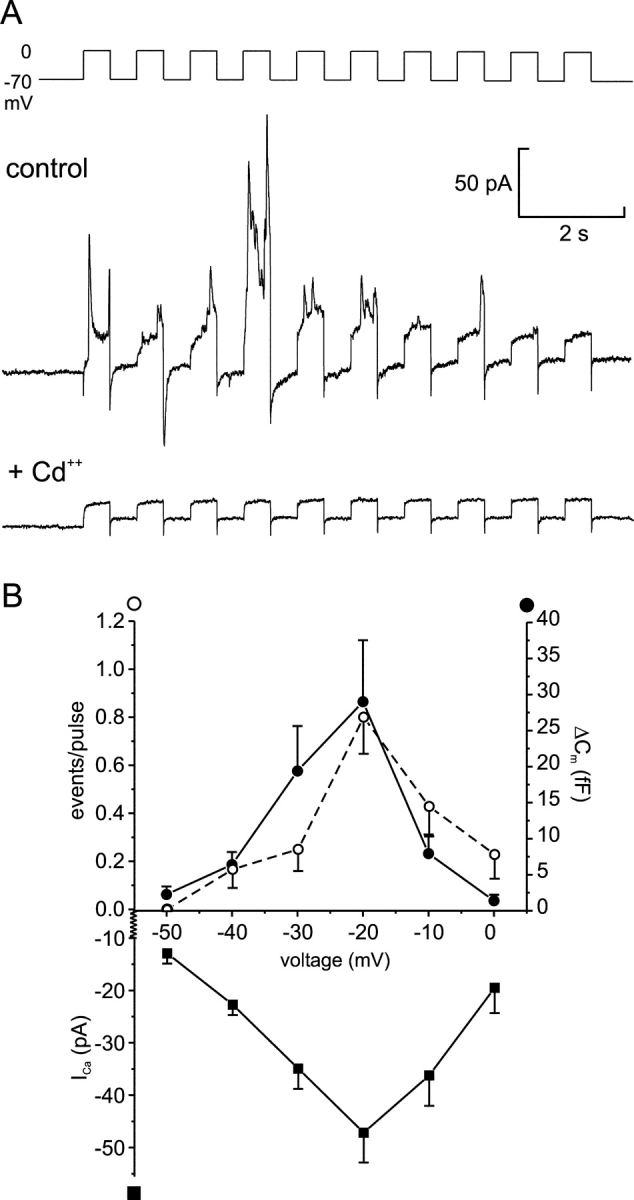
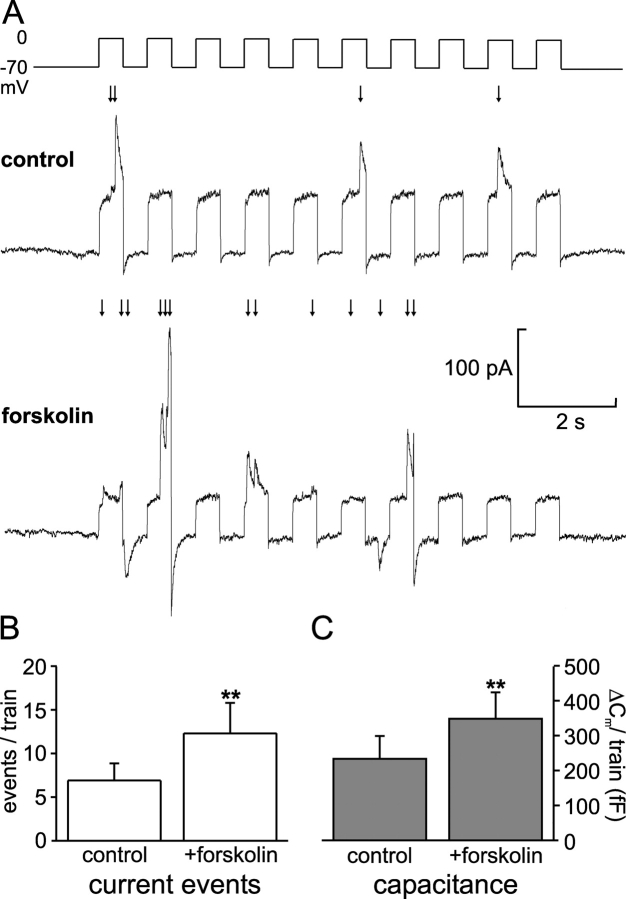
We have explored whether gamma-aminobutyric acid (GABA) is released by regulated exocytosis of GABA-containing synaptic-like microvesicles (SLMVs) in insulin-releasing rat pancreatic beta-cells. To this end, beta-cells were engineered to express GABA(A)-receptor Cl(-)-channels at high density using adenoviral infection. Electron microscopy indicated that the average diameter of the SLMVs is 90 nm, that every beta-cell contains approximately 3,500 such vesicles, and that insulin-containing large dense core vesicles exclude GABA. Quantal release of GABA, seen as rapidly activating and deactivating Cl(-)-currents, was observed during membrane depolarizations from -70 mV to voltages beyond -40 mV or when Ca(2+) was dialysed into the cell interior. Depolarization-evoked GABA release was suppressed when Ca(2+) entry was inhibited using Cd(2+). Analysis of the kinetics of GABA release revealed that GABA-containing vesicles can be divided into a readily releasable pool and a reserve pool. Simultaneous measurements of GABA release and cell capacitance indicated that exocytosis of SLMVs contributes approximately 1% of the capacitance signal. Mathematical analysis of the release events suggests that every SLMV contains 0.36 amol of GABA. We conclude that there are two parallel pathways of exocytosis in pancreatic beta-cells and that release of GABA may accordingly be temporally and spatially separated from insulin secretion. This provides a basis for paracrine GABAergic signaling within the islet.


Figures

F<sc>igure</sc> 1.
Figure 1.
Localization of GABA and β-cell ultrastructure. (A) Electron micrograph of a rat pancreatic islet. Three docked insulin-containing LDCVs and two docked GABA-containing SLMVs have been highlighted by the black and white arrows, respectively. Bar, 250 nm. (B) Diameters of SLMVs and LDCVs in rat pancreatic β-cells. Two Gaussians have been approximated to the distribution of the profile diameters of the SLMVs and LDCVs. (C) Immunofluorescence micrograph of β-cells maintained in tissue culture for 24 h using specific antibodies against insulin (red, left) and GABA (green, right). Note the low GABA content of some β-cells (indicated by arrows). Bar, 5 μm. (D) Immunogold labeling of GABA in a β-cell in an intact islet. Bar, 500 nm.
F<sc>igure</sc> 2.
Figure 2.
Overexpression of GABAA receptors in β-cells. (A) Western blot of homogenates of rat islet cells (∼150 islets) infected or not with the adenoviral constructs encoding the GABAA-receptor Cl channels, using an antibody against the α1 subunit (top), and the corresponding densitograms (below). The bands in the noninfected samples may correspond to endogenous α1 subunits in non-β-cells. (B) Immunofluorescence micrograph of a β-cell infected with the adenoviral constructs using antibodies against the α1 subunit of the GABAA receptor (green) and insulin (red). Bar, 5 μm. (C) Inward current activated in an infected β-cell by rapid application of GABA (1 mM) to the bath solution. (D) Relationship between the GABA concentration and the peak amplitude of the Cl-current responses. The current responses have been normalized to the maximum peak current (usually observed in response to 1 mM GABA). All concentrations were tested in the same cell. Data are mean values ± SEM of five experiments. The Hill equation was approximated to the data points giving a Kd of 30 μM.
F<sc>igure</sc> 3.
Figure 3.
Quantal release of GABA. (A) Current trace (overlay of six sweeps) from an infected β-cell infused with pipette solution containing 3 mM free Ca2+ at −70 mV holding potential. Cl current spikes, corresponding to spontaneous release of GABA-containing vesicles, are superimposed on the background current. (B) Recording from another cell under the same experimental conditions as in A before (top) and after (middle) addition of the GABAA receptor antagonist bicuculline to the bath solution and after washout of the antagonist (bottom; each trace corresponds to five superimposed sweeps).
F<sc>igure</sc> 4.
Figure 4.
Properties of quantal GABA release. (A, left) Two transient currents illustrating the variability of the current amplitudes. (Right) Amplitude-corrected overlay the first (red) and second (black) transient current from the left panel, demonstrating the similarity in current kinetics. (B) Rise time (10–90%) displayed against current amplitude. (C) Duration (half widths) of current transients displayed against current amplitude. For display purposes, the data presented in B an C are presented as mean values ± SEM of 10 amplitude-matched responses. (D) Distribution of the cubic roots of transient current amplitudes (formula image) of the same events as in those presented in A–C. A Gaussian fit is superimposed (N = number of events). (E) Experimentally measured GABA-activated Cl-current transient (mean of 12 events; continuous line) and current response obtained by mathematical modelling (circles).
F<sc>igure</sc> 5.
Figure 5.
Depolarization-induced exocytosis. (A) Transient Cl currents (bottom) and increase in cell capacitance (middle) triggered by a train of ten 500-ms depolarizations from −70 to 0 mV in an infected β-cell. (Inset) A part of the recording (marked by the dashed box) on an expanded time base, including five transient Cl currents. Note that the driving force for Cl ions is inward (corresponding to an upward deflection of the current trace) at 0 mV and outward at −70 mV with the solutions used. While some transient currents were observed between the depolarization pulses, no events were observed before the train. (B) Number of Cl current transients (N) elicited by the individual depolarization pulses during trains of 10 500-ms depolarizations from −70 to 0 mV during a first train (black bars) and a second train applied 2 min later (white bars, n = 5).
F<sc>igure</sc> 6.
Figure 6.
Ca2+ dependence of GABA release. (A) Cl current transients (top) and increase in cell capacitance (middle) elicited by an increase in [Ca2+]i (bottom) produced by photorelease from caged Ca2+ preloaded into the cell. The cell was held at −70 mV and the time of photoliberation is indicated by the arrow (artifacts in the capacitance trace caused by the Cl current transients have been removed). (B) Representative recordings of Cl current transients (indicated by arrows) from cells infused with pipette solution containing 3 μM (top) or 25 μM (bottom) free Ca2+.
F<sc>igure</sc> 7.
Figure 7.
Depolarization-evoked GABA release requires Ca2+-influx through voltage-gated Ca2+-channels. (A) Current responses elicited by a train of ten 500-ms depolarizations from −70 to 0 mV before (top) and after (bottom) addition of CdCl2 (10 μM) to the bath solution. (B) Cl current transients (open circles), capacitance increase (ΔCm; filled circles), and peak Ca2+ current (ICa; squares) triggered by 500-ms depolarizations from −70 mV to the indicated potentials. All data points correspond to average ± SEM from 8–35 experiments. Note that there is an ∼20 mV difference in the liquid junction potential between the intracellular solution used in this series of experiments and those used in most other experiments. Thus, the voltage experienced by the cells during depolarization to 0 mV in Figs. 5, A and B, and 7 A is comparable to −20 mV in this series of experiments.
F<sc>igure</sc> 8.
Figure 8.
cAMP stimulation of GABA exocytosis. (A) Cl current transients elicited by trains of 500-ms depolarizations before (top) and 2 min after (bottom) addition of forskolin (2 μM) to the bath solution. (B) Histogram summarizing the GABA release events elicited per train under control conditions and after stimulation with forskolin. (C) As in B but instead showing the total increase in cell capacitance (ΔCm) elicited by the train. In B and C, the data are mean values ± SEM of 10 experiments.

Similar articles

Cited by

References

    1. Ahnert-Hilger, G., and B. Wiedenmann. 1992. The amphicrine pancreatic cell line, AR42J, secretes GABA and amylase by separate regulated pathways. FEBS Lett. 314:41–44. - PubMed
    1. Albillos, A., G. Dernick, H. Horstmann, W. Almers, G. Alvarez de Toledo, and M. Lindau. 1997. The exocytotic event in chromaffin cells revealed by patch amperometry. Nature. 389:509–512. - PubMed
    1. Amatore, C., Y. Bouret, E.R. Travis, and R.M. Wightman. 2000. Interplay between membrane dynamics, diffusion and swelling pressure governs individual vesicular exocytotic events during release of adrenaline by chromaffin cells. Biochimie. 82:481–496. - PubMed
    1. Ämmälä, C., F.M. Ashcroft, and P. Rorsman. 1993. Calcium-independent potentiation of insulin release by cyclic AMP in single β-cells. Nature. 363:356–358. - PubMed
    1. Antunes, C.M., A.P. Salgado, L.M. Rosario, and R.M. Santos. 2000. Differential patterns of glucose-induced electrical activity and intracellular calcium responses in single mouse and rat pancreatic islets. Diabetes. 49:2028–2038. - PubMed

Publication types