Comparative Study
. 2004 Mar;123(3):205-16.
doi: 10.1085/jgp.200308993. Epub 2004 Feb 9.

Specificity of charge-carrying residues in the voltage sensor of potassium channels

Affiliations
Comparative Study

Specificity of charge-carrying residues in the voltage sensor of potassium channels

Christopher A Ahern et al. J Gen Physiol. 2004 Mar.

Abstract

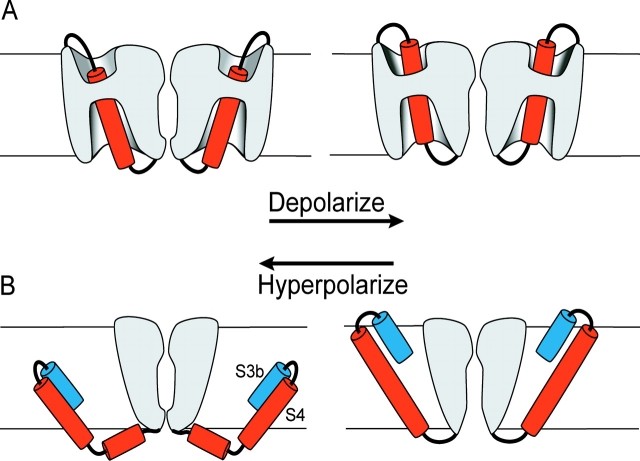
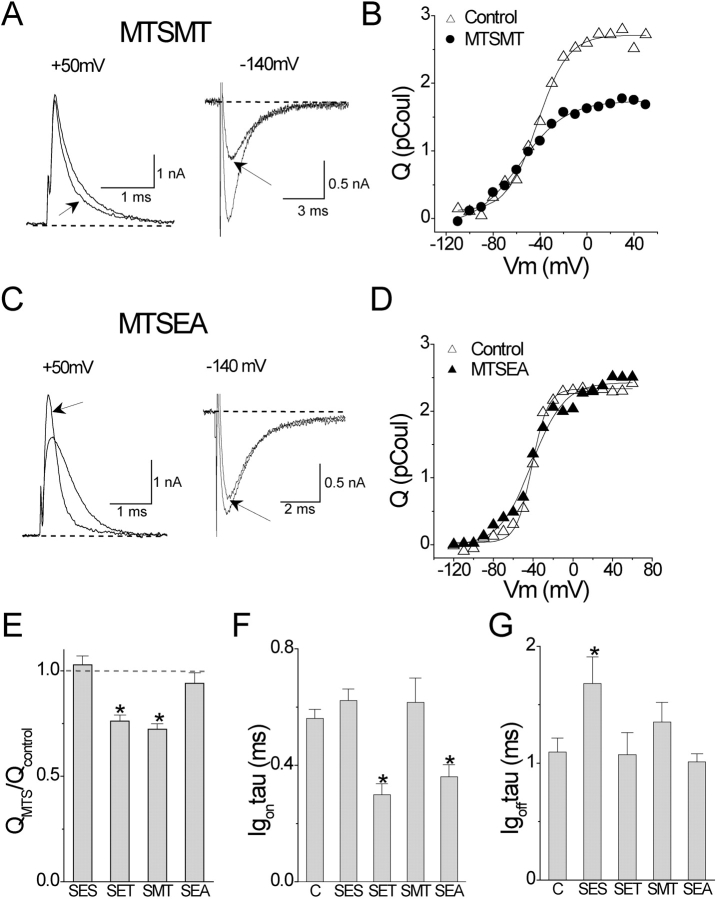
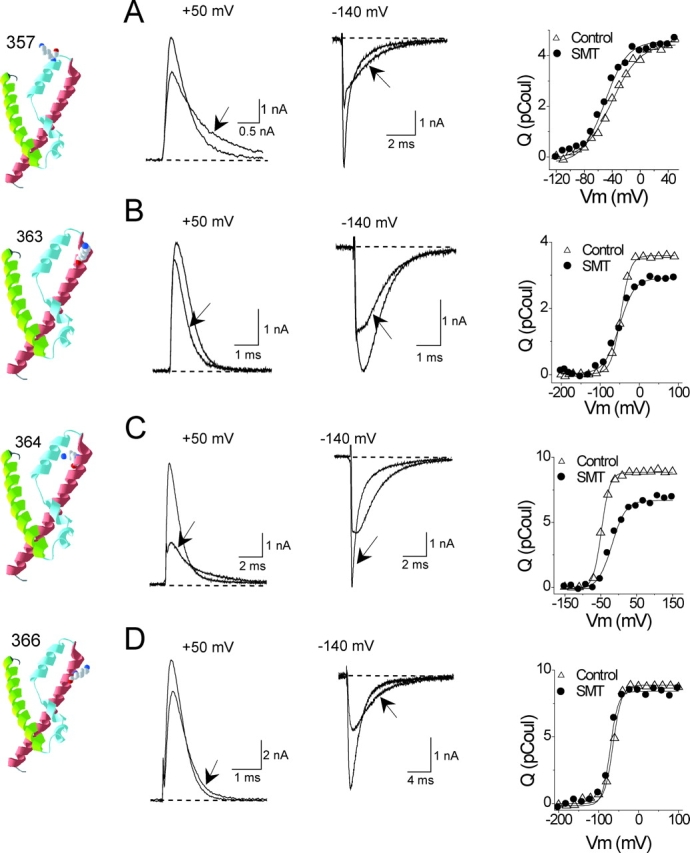
Positively charged voltage sensors of sodium and potassium channels are driven outward through the membrane's electric field upon depolarization. This movement is coupled to channel opening. A recent model based on studies of the KvAP channel proposes that the positively charged voltage sensor, christened the "voltage-sensor paddle", is a peripheral domain that shuttles its charged cargo through membrane lipid like a hydrophobic cation. We tested this idea by attaching charged adducts to cysteines introduced into the putative voltage-sensor paddle of Shaker potassium channels and measuring fractional changes in the total gating charge from gating currents. The only residues capable of translocating attached charges through the membrane-electric field are those that serve this function in the native channel. This remarkable specificity indicates that charge movement involves highly specialized interactions between the voltage sensor and other regions of the protein, a mechanism inconsistent with the paddle model.


Figures

F<sc>igure</sc> 1.
Figure 1.
Models of voltage-sensor movement. (A) Conventional model of voltage-sensor movement. Two opposing subunits are shown with the ion permeation path between them. Depolarization moves the extracellular portion of the S4 segment (red) outward through a short gating pore, opening the permeation pathway. Most of the S4 segment is surrounded by hydrophilic crevices/vestibules. The transmembrane-electric field falls mainly across the short gating pore. (B) Paddle model adapted from Jiang et al. (2003b). Two opposing subunits are shown. Depolarization moves the paddle, the S3b helix and extracellular end of the S4 segment, outward through lipid, pulling the cytoplasmic activation gate open.
F<sc>igure</sc> 2.
Figure 2.
Time course of cysteine modification of S357C by 2.5 mM MTSES. (A) Cs+ currents elicited at +20 mV in the conducting variant. The pulse protocol is shown, and the experiment described in more detail in materials and methods. (B) Isochronal currents measured near the end of the test pulse. The fitted line is an exponential function with a time constant of 8.8 s.
F<sc>igure</sc> 3.
Figure 3.
Modification of A359C/W434F by MTSES. The crystal structure of S2–S4 from the isolated voltage-sensor domain of KvAP (Jiang et al., 2003a) is shown, with A359C represented as a lysine, the approximate structure of a cysteine modified by MTSEA. Drawn using DeepView/Swiss-PdbViewer (http://us.expasy.org). (A and B) Gating currents elicited by depolarizations from −70 to +50 mV in 10-mV increments. Holding potential, −120 mV; tail potential, −140 mV. Effect of MTSES shown in B. (C) ON gating currents at +50 mV and OFF gating currents at −140 mV after a step to +50 mV from the same cell shown in (A and B). The arrow indicates the MTS-modified current. (D) Un-normalized Q-V curves from the same cell.
F<sc>igure</sc> 4.
Figure 4.
Modification of A359C by MTSES. All panels used the nonconducting (W434F) variant except E. (A–D) As in Fig. 3. (E) Ionic (Cs+) and gating currents from a MTSET-modified cell. Holding potential, −140 mV. Depolarization to +35 mV, the reversal potential for ionic current, reveals a pure gating current. The subsequent depolarization to +65 mV is a pure ionic current. Currents before and after modification are superimposed, showing characteristic effects on gating current, but none on ionic current. Bath (in mM): 152 CsCl, 1.5 CaCl2, 1 MgCl2, 10 Na-HEPES (pH 7.4). Internal: 37.5 CsCl, 102.5 N-methyl-D-glucamine chloride, 10 EGTA, 10 HEPES (pH 7.3).
F<sc>igure</sc> 5.
Figure 5.
Modification of A359C/W434F by MTS reagents. (A–D) ON and OFF gating currents and Q-V curves, as in Fig. 3. (E) Fractional effect of all MTS reagents on Q tot of A359C/W434F. (F) Effect of MTS reagents on time constant of ON gating current at +50 mV. (G) Effect of MTS reagents on time constant of OFF gating current at −140 mV after a depolarization to +50 mV.
F<sc>igure</sc> 6.
Figure 6.
Modification of neutral residues. (A–D) Effects on gating currents and Q-V curves of MTSMT modification of indicated residues, labeled as in Figs. 3–5.
F<sc>igure</sc> 7.
Figure 7.
Summary of effects of MTS reagents on S357C, V363C, I364C, and L366C. (A–C) Effects on Q tot and gating current kinetics, as in Fig. 5, E–G. Two time constants were required to fit data for I364C/W434F after MTSMT modification. n = 3–14 cells for each measurement.
F<sc>igure</sc> 8.
Figure 8.
Modification of R362C/W434F. (A–D) Effect of MTSEA and MTSES modification in oocytes expressing R362C/W434F. Currents recorded by two-microelectrode voltage clamp. Holding and tail potential, −100 mV; 20-mV steps between −140 and +100 mV. Linear capacity–corrected currents used a 20-mV depolarization from +60 mV. Q-V relationships obtained from uncorrected currents (Aggarwal and MacKinnon, 1996). (E) Fractional effect of modification of R362C/W434F on Q tot. Dashed lines are predictions for adding one positive charge (1.44) or one negative charge (0.56) to each S4 segment. Cationic adducts increase Q tot by an amount insignificantly different from the predicted 44%, but significantly different from the control (*, P < 0.01). MTSES modification causes a significant reduction of Q tot (*), but not down to the predicted level.
F<sc>igure</sc> 9.
Figure 9.
Modification of R365C/W434F. (A–D) Effect of MTSEA and MTSES modification in tsA201 cells. Q-V obtained as described in Fig. 8. Control shows currents between −240 and +120 mV in 40-mV steps; after modification from −150 to +120 mV in 30-mV steps (A); or from −150 to +100 mV in 50-mV steps (C). Holding and tail potential, −100 and −120 mV, respectively. Control Q-V curves were fit to a double Boltzmann function with the following estimated parameters: V mid1 = −142.5 ± 3.2 mV; q 1 = 1.75 ± 0.35 e0; V mid2 = −4.4 ± 2.9 mV; q 2 = 2.16 ± 0.43 e0; w1 = 0.36 ± 0.03; n = 12. w1 is the fractional weight of the hyperpolarized component. (E) Fractional effect of modification of R365C/W434F on Q tot. MTSES modification reduces Q tot significantly less than predicted for the addition of one negative charge.
F<sc>igure</sc> 10.
Figure 10.
Helical screw model. Shaker S4 model superimposed on the pore domain represented by the KcsA crystal structure (Doyle et al., 1998). Only three of the four S4 segments are shown for clarity. The amorphous peripheral domains that enclose S4 segments (shown only for two opposing subunits) consist of the S1–S3 segments, with critical negative charges (in red) contributed by the S2 and S3 segments (Papazian et al., 1995). The blue and white side-chains are for the basic residues, showing the charged spiral around the S4 segment. Residues 363 (green), 364 (purple), and 366 (orange) are shown as lysines, indicative of the approximate structure of a cysteine modified by MTSEA. The orientation of the S4 segment is ∼40° to the vertical axis of the pore domain (Li-Smerin et al., 2000), allowing close approach between R362 and the top of an adjacent subunit at a depolarized voltage (Broomand et al., 2003; Lainé et al., 2003; Neale et al., 2003). A helical wheel shows the three outermost arginines on the opposite face of the four neutral residues that lie between them.

References

    1. Aggarwal, S.K., and R. MacKinnon. 1996. Contribution of the S4 segment to gating charge in the Shaker K+ channel. Neuron. 16:1169–1177. - PubMed
    1. Baker, O.S., H.P. Larsson, L.M. Mannuzzu, and E.Y. Isacoff. 1998. Three transmembrane conformations and sequence-dependent displacement of the S4 domain in Shaker K+ channel gating. Neuron. 20:1283–1294. - PubMed
    1. Bezanilla, F. 2000. The voltage sensor in voltage dependent ion channels. Physiol. Rev. 80:555–592. - PubMed
    1. Bezanilla, F. 2002. Voltage sensor movements. J. Gen. Physiol. 120:465–473. - PMC - PubMed
    1. Blaustein, R.O., P.A. Cole, C. Williams, and C. Miller. 2000. Tethered blockers as molecular ‘tape measures’ for a voltage-gated K+ channel. Nat. Struct. Biol. 7:309–311. - PubMed

Publication types

MeSH terms

Substances