. 2004 Feb 16;164(4):603-12.
doi: 10.1083/jcb.200306090. Epub 2004 Feb 9.

Polarity and proliferation are controlled by distinct signaling pathways downstream of PI3-kinase in breast epithelial tumor cells

Affiliations

Polarity and proliferation are controlled by distinct signaling pathways downstream of PI3-kinase in breast epithelial tumor cells

Hong Liu et al. J Cell Biol. .

Abstract

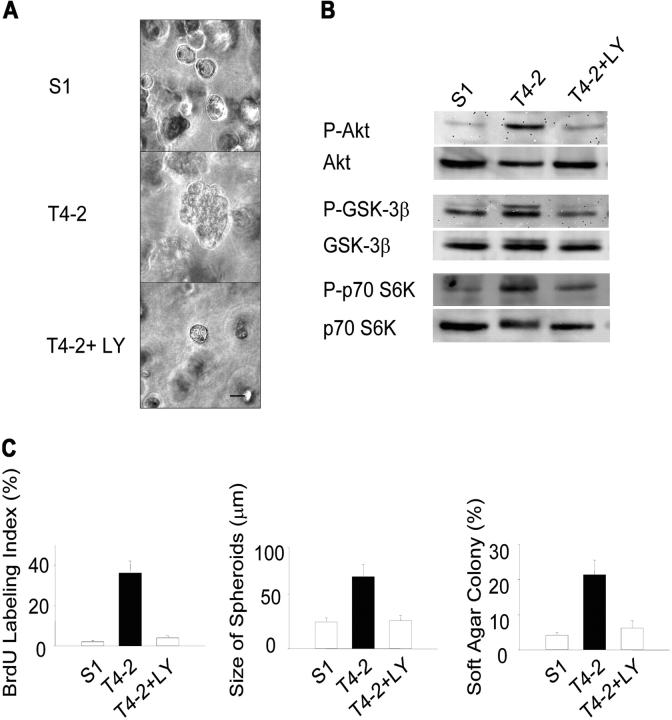
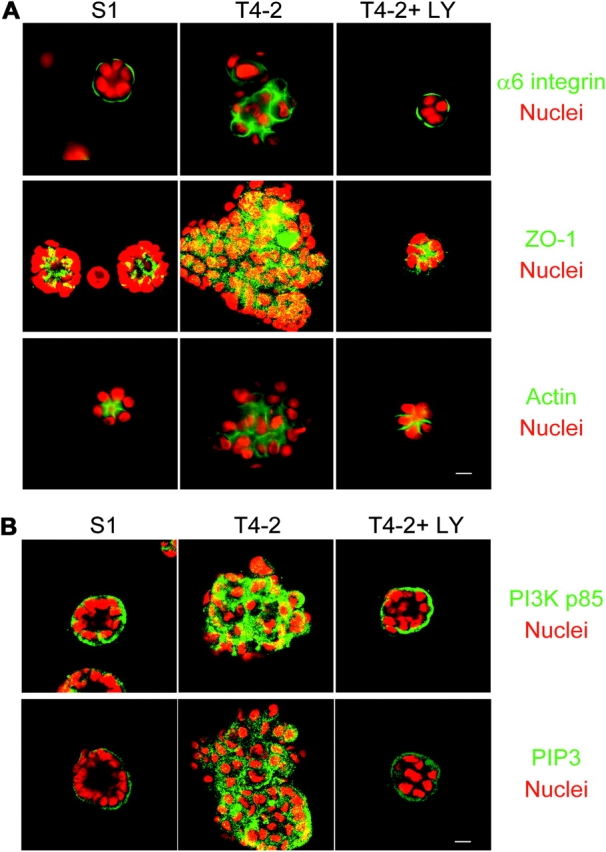
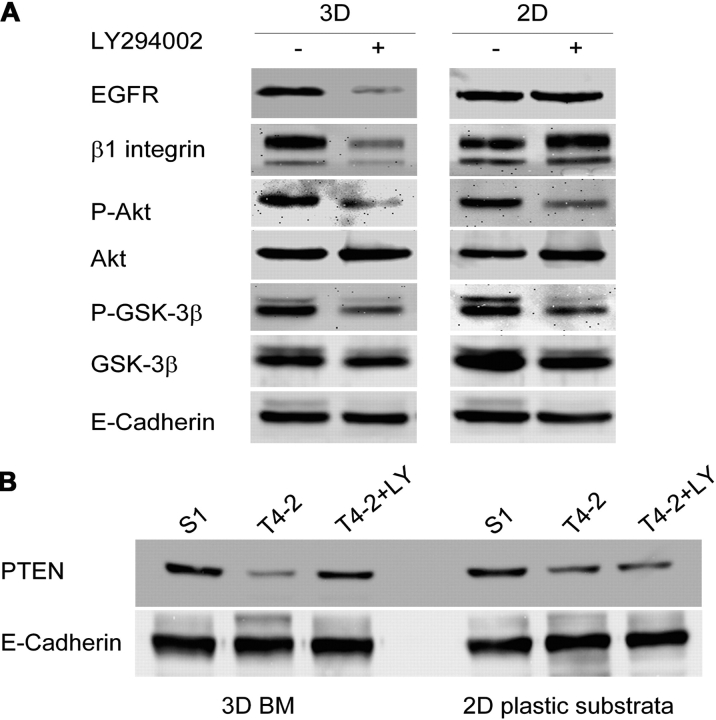
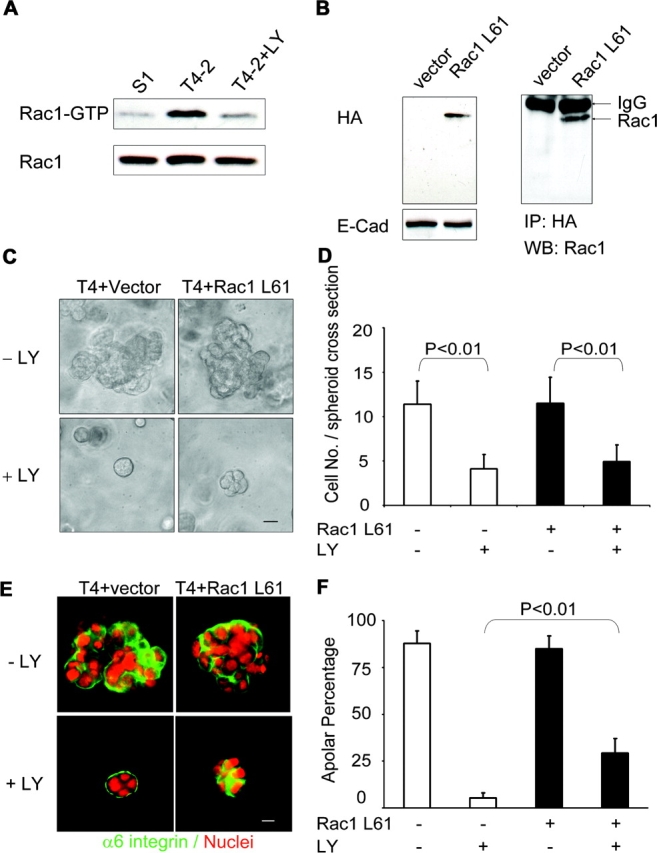
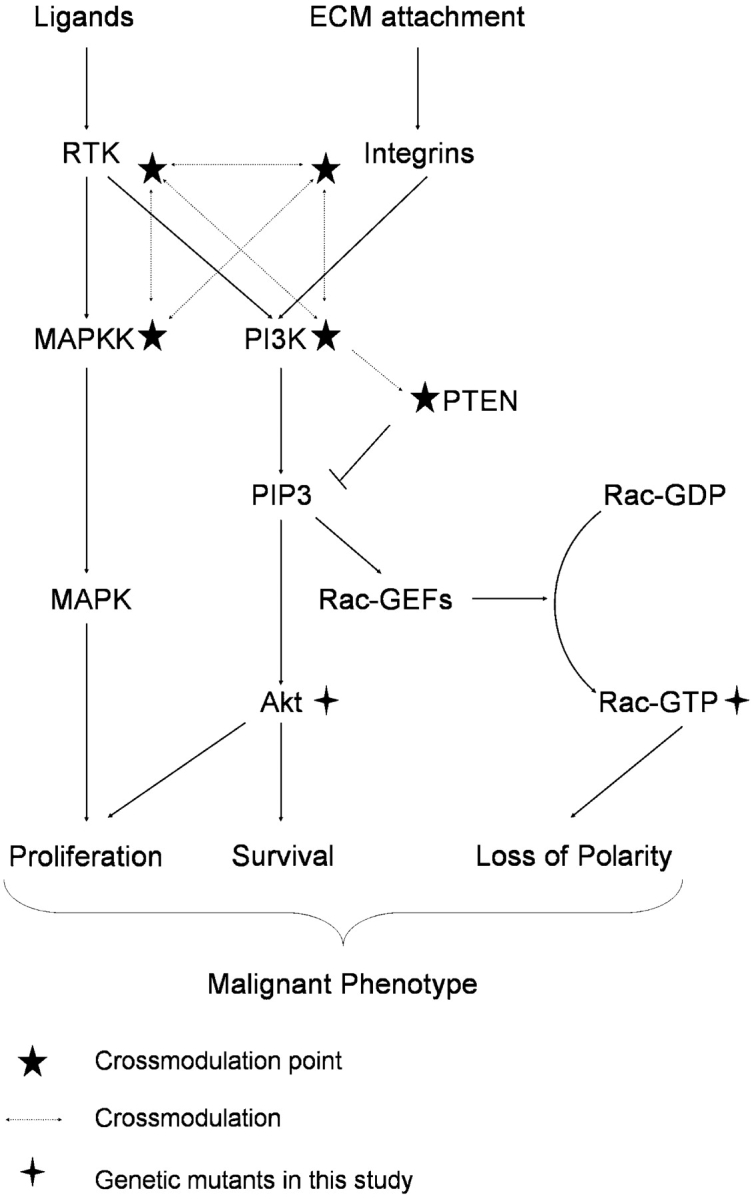
Loss of tissue polarity and increased proliferation are the characteristic alterations of the breast tumor phenotype. To investigate these processes, we used a three-dimensional (3D) culture system in which malignant human breast cells can be reverted to a normal phenotype by exposure to inhibitors of phosphatidylinositol 3-kinase (PI3K). Using this assay, we find that Akt and Rac1 act as downstream effectors of PI3K and function as control points of cellular proliferation and tissue polarity, respectively. Our results also demonstrate that the PI3K signaling pathway is an integral component of the overall signaling network induced by growth in 3D, as reversion affected by inhibition of PI3K signaling also down-modulates the endogenous levels of beta1 integrin and epidermal growth factor receptor, the upstream modulators of PI3K, and up-regulates PTEN, the antagonist of PI3K. These findings reveal key events of the PI3K pathway that play distinct roles to maintain tissue polarity and that when disrupted are instrumental in the malignant phenotype.


Figures

Figure 1.
Figure 1.
Attenuation of PI3K activity results in phenotypic reversion of HMT-3522 T4-2 human mammary tumor cells cultured in 3D BM. (A) Phase contrast micrographs of 10-d 3D lrBM cultures of phenotypically normal (S-1), malignant (T4-2), and T4-2 cells treated with 8 μM PI3K inhibitor, LY294002 (T4-2+LY). Bar, 20 μm. (B) Cell lysates from 10-d 3D lrBM cultures were analyzed for phosphorylated Akt (serine 473)/total, phosphorylated GSK-3β (serine 9)/total, and phosphorylated p70 S6 kinase (threonine 389)/total by Western blot. (C) Inhibition of PI3K causes a reduction in cellular proliferation (left, BrdU labeling assay, n = 3), colony size (center, 50 colonies assessed for each experiment, n = 3), and anchorage-independent growth (right, soft agar assay, colonies scored positive when >50 μm, n = 3).
Figure 2.
Figure 2.
Inhibition of PI3K results in reestablishment of tissue polarity. (A) Down-modulation of PI3K activity of T4-2 cells was sufficient to repolarize the apicolateral tight junction protein ZO-1 and the basal ECM receptor, α6 integrin, and to result in the reorganization of the actin cytoskeleton. (B) PI3K and its phospholipid product, PIP3, are basolaterally localized in S-1 acini, apolarly distributed in the T4-2 colonies, and normalized in the reverted T4-2 structures. For both A and B, S-1, T4-2, and T4-2+ LY (revertants) were cultured for 10 d in 3D lrBM. α6 integrin, ZO-1, actin, PI3K p85 subunit, and PIP3 were stained by specific antibodies and phalloidin-FITC, and imaged by confocal fluorescence microscopy. Bars, 10 μm.
Figure 3.
Figure 3.
Attenuation of PI3K activity results in cross-modulation of other signaling pathways and intermediates. Cell lysates from S-1, T4-2, and T4-2+LY grown in 3D lrBM or on 2D plastic substrata for 10 d were analyzed for expression of (A) EGFR, β1 integrin, phosphorylated Akt (serine 473)/total, phosphorylated GSK-3β (serine 9)/total, and (B) PTEN (n = 3); E-cadherin was used as the loading control. It was shown previously that the total level of E-cadherin does not change under these conditions (Weaver et al., 1997).
Figure 4.
Figure 4.
Expression of Akt increases proliferation but does not affect polarity. (A) Expression of constitutively active Akt in T4-2 cells (Myr-Akt), detected by Western analysis of cells infected with Myr-Akt (+) or vector control (−), and probed with anti-Akt (left) or anti-HA antibodies (right). (B) Activity of Myr-Akt mutant and its downstream target were not affected by PI3K inhibitor LY294002; cell lysates from T4-2 and T4-2+LY expressing Myr-Akt or vector grown in 3D lrBM for 10 d were analyzed for phosphorylated Akt (serine 473)/total and GSK-3β (serine 9)/total. (C) T4+Myr-Akt colonies were larger than control (T4-2+Vector) colonies, both in the presence and absence of LY294002, as assessed by phase contrast microscopy. Bar, 20 μm. (D) T4-2 + Myr-Akt colonies had more nuclei per spheroid cross section. Total nuclear number at spheroid cross section and spheroid numbers were counted and are presented as cell number per spheroid cross section. Statistical analyses revealed significant differences between Myr-Akt and vector control (mean ± SD, P values calculated using Student's t test; more than 500 colonies from 5 independent experiments were analyzed for each condition). (E) Constitutively active Akt signaling did not affect the basal tissue repolarization when T4-2+Myr-Akt cells were reverted by PI3K inhibitor, as assessed by basal localization of α6 integrin relative to DAPI-stained nuclei. Bar, 10 μm. (F) Quantitative analysis of polarity by percentage of spheroids without polarized distribution of basal α6 integrin. No significant difference was found between Myr-Akt and vector control for each condition (mean ± SD, P > 0.05, Student's t test; more than 600 colonies were analyzed for each condition from 3 independent experiments).
Figure 5.
Figure 5.
Expression of Rac1 disrupts tissue polarity but does not prevent proliferation arrest. (A) Rac1 activity correlates with PI3K activity, analyzed by using recombinant PAK-GST-CD fusion protein pulldown from lysates of 10-d 3D lrBM cultures of S-1, T4-2, and T4-2+LY cells. (B) Expression of constitutively active Rac1 L61, detected from lysates of cells infected with Rac1L61 or vector control and probed with anti-HA antibody (left) or immunoprecipitated with anti-HA antibody and blotted by anti-Rac1 antibody (right). (C) Inhibition of PI3K attenuates growth of both T4-2+Rac1 L61 colonies and control (T4-2+Vector) colonies, as assessed by phase contrast microscopy. Bar, 20 μm. (D) Analysis of total nuclear number at spheroid cross section reveals that treatment with LY294002 causes statistically signinficant decrease of colony cell number, but expression of Rac1L61 causes no substantial difference (mean ± SD, P values calculated using Student's t test; more than 300 colonies were analyzed from 3 independent experiments for each condition). (E) Attenuation of PI3K activity does not restore tissue polarity in T4-2 cells that express Rac1 L61, as assessed by immunofluorescence of vector control or transfected cells, stained with antibody against α6 integrin and with DAPI. Bar, 10 μm. (F) Statistical analysis of data in E, in which polarity was assessed by percentage of spheroids without polarized distribution of α6 integrin at basal surface (mean ± SD, P < 0.01, vector control versus Rac1 L61 cells treated with LY294002, Student's t test; more than 700 colonies were analyzed for each condition from 3 independent experiments).
Figure 6.
Figure 6.
Simultaneous expression of both Akt and Rac1 is sufficient to prevent reversion induced by attenuation of PI3K activity. (A) Expression of both constitutively active Akt (Myr-Akt) and Rac1 (Rac1 L61) in T4-2 cells was detected by probing Western blots of cell lysates with anti-HA antibody. (B) PI3K inhibition fails to decrease proliferation and to restore tissue organization in Myr-Akt and Rac1 L61-double transfectants, as assessed by phase contrast microscopy and (C) by increased nuclei per spheroid cross section (mean ± SD, P values calculated using Student's t test; more than 300 colonies were analyzed for each condition from three independent experiments). Bar in B, 20 μm. (D) Restoration of basal tissue polarity is disrupted in double transfectants, as assessed by aberrant location of α6 integrin in LY294002-treated T4-2 Myr-Akt+Rac1 L61 cells grown in 3D lrBM for 10 d. Representative images from three independent experiments are shown. Bar, 10 μm. (E) Myr-Akt and Rac1 L61 double transfectants collaborate to increase anchorage-independent cell growth and overcome the inhibitory effects of treatment with PI3K inhibitor. Transfectants were grown in methyl cellulose for 3 wk in the absence or presence of PI3K inhibitor. Representative images are shown from duplicate experiments.
Figure 7.
Figure 7.
Scheme of proposed tumor cell signaling network to control polarity, proliferation, and apoptosis. T4-2 signaling network. PI3K activity is increased in tumor cells as a result of aberrant signaling from cell–ECM and cell–growth factor receptor interactions. The consequent activation of Akt contributes to the increased cellular proliferation through downstream pro-proliferation and anti-apoptotic pathways. Increased PIP3 also leads to up-regulation of Rac1 through activation of Rac1-specific GEF activity, resulting in altered organization of the actin cytoskeleton, formation and maintenance of tight junctions, and directionality of vesicle trafficking, effects that combine to disorganize the tissue structure. Thus, each pathway independently affects cellular behavior, but the synergistic effect leads to the tumor phenotype. (★) Cross-modulation in 3D lrBM. Inhibition at any of these pressure points results in normalization of the expression and activity at each of the other points, with concomitant normalization of downstream signaling pathways.

References

    1. Bissell, M.J., and D. Radisky. 2001. Putting tumours in context. Nat. Rev. Cancer. 1:46–54. - PMC - PubMed
    1. Chan, T.O., S.E. Rittenhouse, and P.N. Tsichlis. 1999. AKT/PKB and other D3 phosphoinositide-regulated kinases: kinase activation by phosphoinositide-dependent phosphorylation. Annu. Rev. Biochem. 68:965–1014. - PubMed
    1. Chen, H.C., and J.L. Guan. 1994. Association of focal adhesion kinase with its potential substrate phosphatidylinositol 3-kinase. Proc. Natl. Acad. Sci. USA. 91:10148–10152. - PMC - PubMed
    1. Chen, R., V.H. Kang, J. Chen, J.C. Shope, J. Torabinejad, D.B. DeWald, and G.D. Prestwich. 2002. A monoclonal antibody to visualize PtdIns(3,4,5)P(3) in cells. J. Histochem. Cytochem. 50:697–708. - PubMed
    1. Comer, F.I., and C.A. Parent. 2002. PI 3-kinases and PTEN: how opposites chemoattract. Cell. 109:541–544. - PubMed

Publication types

MeSH terms