

doi: 10.1083/jcb.200311119.
Epub 2004 Feb 9.
Bicarbonate-responsive "soluble" adenylyl cyclase defines a nuclear cAMP microdomain
Affiliations
- PMID: 14769862
- PMCID: PMC2172001
- DOI: 10.1083/jcb.200311119
Item in Clipboard
Bicarbonate-responsive "soluble" adenylyl cyclase defines a nuclear cAMP microdomain
J Cell Biol.
.
Abstract
Bicarbonate-responsive "soluble" adenylyl cyclase resides, in part, inside the mammalian cell nucleus where it stimulates the activity of nuclear protein kinase A to phosphorylate the cAMP response element binding protein (CREB). The existence of this complete and functional, nuclear-localized cAMP pathway establishes that cAMP signals in intracellular microdomains and identifies an alternate pathway leading to CREB activation.
Copyright The Rockefeller University Press
Figures
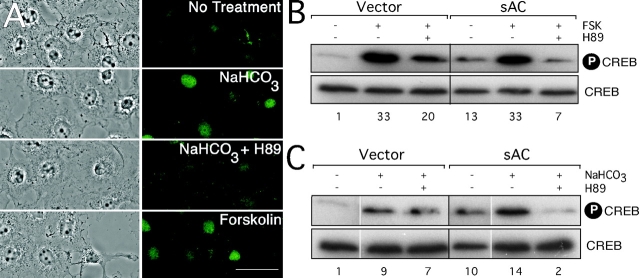
Bicarbonate induces CREB phosphorylation via sAC activation in a PKA-dependent manner. (A) COS7 cells were starved for bicarbonate 60 min and were either incubated in the same bicarbonate starvation media for an additional 30 min (No Treatment), incubated in normal, bicarbonate-containing DME in 5% CO2 for 30 min (NaHCO3), or preincubated with 10 μM H89 for 10 min followed by incubation in normal, bicarbonate-containing DME in 5% CO2 for 30 min (NaHCO3 + H89). As a control, COS7 cells grown in normal DME in 5% CO2 were incubated with 10 μM of forskolin for 30 min (Forskolin). Cells were immunostained with phospho-CREB antisera (green). Left, phase images of cells on right. Bar, 50 μm. (B) COS7 cells were transfected with vector control or a 48-kD isoform of sAC, and cells were assayed 36 h after transfection. Cells were treated with vehicle control (DMSO) or 10 μM H89 for 10 min and stimulated with 10 μM of forskolin or given vehicle control (DMSO) for an additional 30 min. (C) Transfected cells were starved for bicarbonate and were either incubated in the same bicarbonate starvation media for an additional 30 min; incubated in normal, bicarbonate-containing DME in 5% CO2 for 30 min; or preincubated with 10 μM H89 for 10 min followed by incubation in normal, bicarbonate-containing DME in 5% CO2 for 30 min. (B and C) Top, Western blot using anti–phospho-CREB antisera with phosphorylated CREB (P-CREB) protein indicated; bottom, Western blot using CREB-specific antisera with total CREB protein indicated. Shown below are the intensities of phospho-CREB relative to CREB normalized to vector control no treatment (first lane).
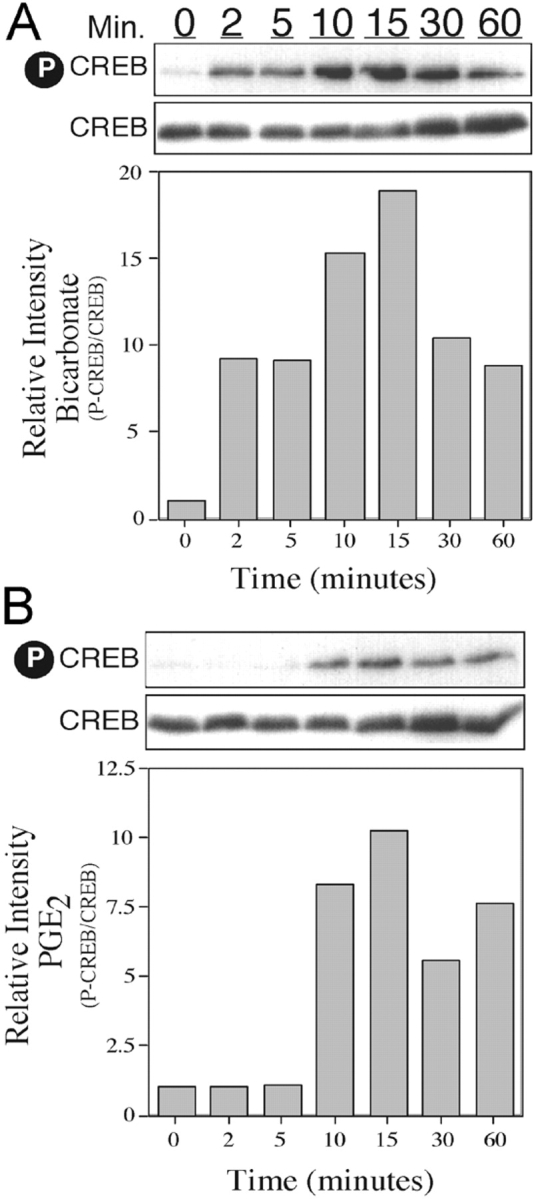
Time course of CREB phosphorylation by sAC and tmAC. (A) Huh7 cells were starved for 1 h for bicarbonate and CO2 and incubated in 44 mM of normal, bicarbonate-containing DME in 5% CO2 for the time indicated or (B) kept in normal media and treated with 1 μM PGE2 for the time indicated. (A and B) Top, Western blot using anti–phospho-CREB antisera with phosphorylated CREB (P-CREB) protein indicated; bottom, Western blot using CREB-specific antisera with total CREB (CREB) protein indicated. Shown below are graphical representations of the intensities of phospho-CREB relative to CREB normalized to the 0 min time point (first lane).
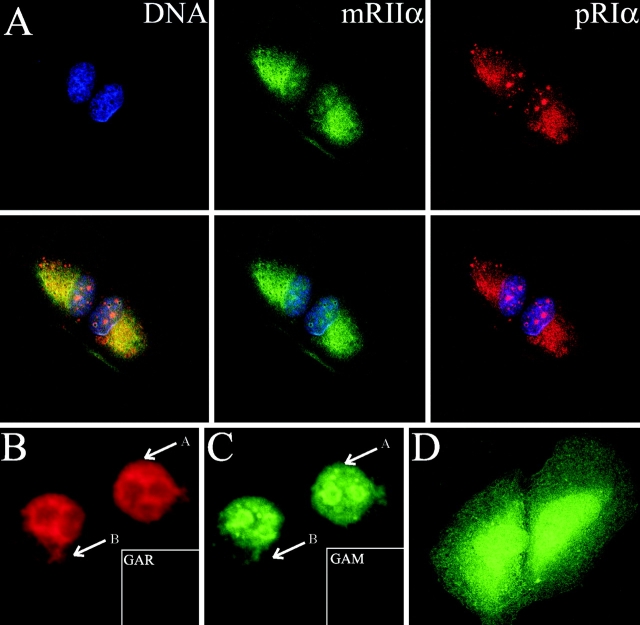
Immunocytochemistry detects both sAC and PKA in the mammalian cell nucleus. (A) Confocal immunocytochemistry of Huh7 cells with monoclonal RIIα (top middle, green) and polyclonal RIα antibody (top right, red). Top left, To-Pro 3. Overlay of To-Pro 3 with both RIIα and RIα (bottom left), RIIα (bottom middle), and RIα (bottom right). Secondary controls were negative (not depicted). (B and C) Confocal images of suspension HeLa cells immunostained with (B) PKA regulatory subunit RIIα polyclonal antisera and (C) PKA regulatory subunit RIα mAb. A and B arrows indicate suspension HeLa cytoplasm. Secondary controls were negative (insets). (D) Confocal immunocytochemistry of Huh7 cells stained with R41 mAb against sAC.
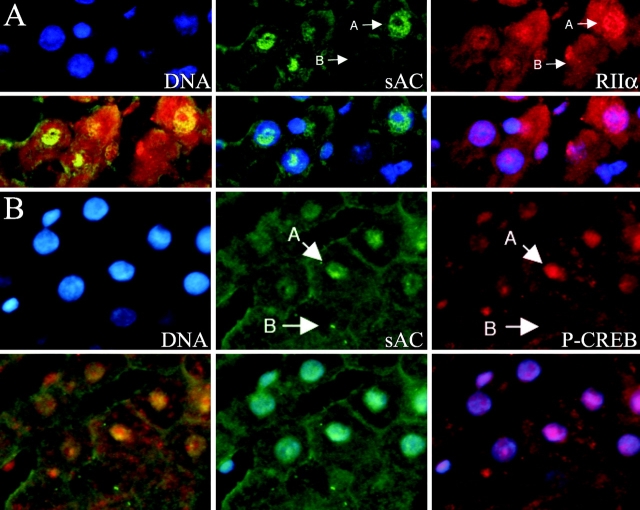
Activated CREB, sAC, and PKA are present within the same rat liver nuclei. (A) Rat liver section stained with DAPI (top left, DNA, blue), R52 biotinylated mAb (top middle, sAC, green), and polyclonal RIIα antisera (top right, RIIα, red); overlays of RIIα and sAC (bottom left), sAC and DAPI (bottom middle), and RIIα and DAPI (bottom right). A arrows indicate nuclei enriched for both sAC and PKA, whereas B arrows indicate nuclei not enriched for either. (B) Rat liver section stained with DAPI (top left, DNA, blue), R21 mAb (top middle, sAC, green), and polyclonal P-CREB antisera (top right, P-CREB, red); overlays of P-CREB and sAC (bottom left), sAC and DAPI (bottom middle), and P-CREB and DAPI (bottom right). A arrows indicate nuclei enriched for both sAC and P-CREB, whereas B arrows indicate nuclei enriched for neither. Rat liver tissue immunolocalization was confirmed to be inside the nucleus by confocal microscopy (not depicted).
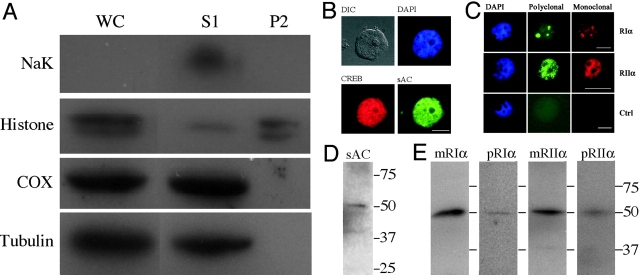
sAC, PKA, and CREB coexist in mammalian cell nuclei. (A) Western blots of cell equivalents from HeLa whole cells (WC), low speed supernatant (S1), and nuclear-enriched high speed pellet (P2) probed with antibodies against NaK ATPase (NaK), histone H1 (Histone), cytochrome oxidase subunit III (COX), and β-tubulin (Tubulin). (B) Immunocytochemistry of nuclei isolated from HeLa cells (P2 pellet) using CREB polyclonal antisera (red) and sAC R52 biotinylated mAb (green). Differential interference contrast microscopy (DIC) and DAPI (blue) images shown. Bar, 10 μm. (C) Nuclei isolated from HeLa cells (P2 pellet) immunostained with polyclonal antisera (green) and mAb (red) directed against both RIα and RIIα indicated that both proteins maintained their nucleoplasmic architecture throughout the fractionation procedure. Bottom row represents staining with goat anti-rabbit (middle) or goat anti-mouse controls (right) alone. Left column represents DAPI images in blue. Bars, 10 μm. (D) Western blot of nuclear enriched P2 for sAC with R21 mAb. (E) Western blots of nuclear enriched P2 pellet with monoclonal (mRIα) and polyclonal (pRIα) antisera against RIα and with monoclonal (mRIIα) and polyclonal (pRIIα) antisera against RIIα. All Westerns blots resolved only single bands of the predicted molecular mass.
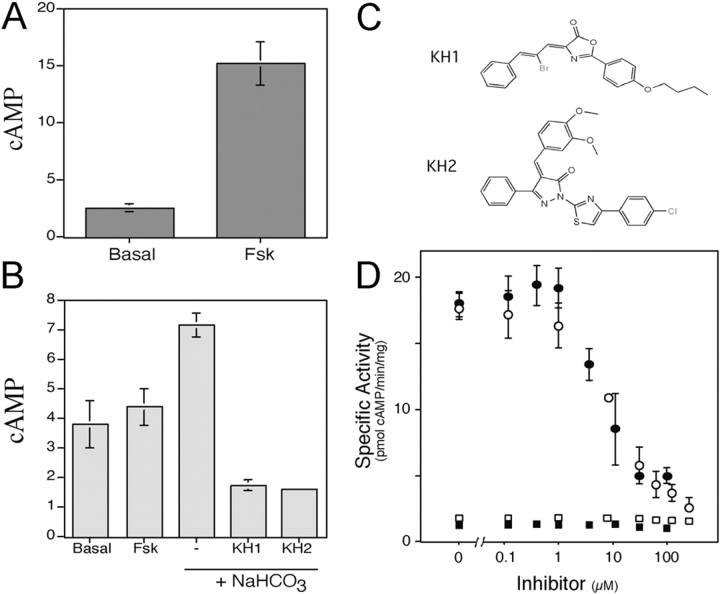
sAC activity is the only detectable adenylyl cyclase activity in the mammalian cell nucleus. (A) Adenylyl cyclase assay of whole cell lysate with Mg2+-ATP alone (Basal) or Mg2+-ATP and forskolin (Fsk). cAMP values are expressed as picomoles produced per milliliter of lysate and represent averages of duplicate determinations with SD about the means indicated. (B) Cyclase assay of nuclear lysate with Mg2+-ATP alone (Basal), or in the presence of 10 μM forskolin (Fsk), or 40 mM of bicarbonate (+NaHCO3) in the absence (−) or presence of the sAC-specific inhibitors KH1 (250 μM) or KH2 (100 μM). cAMP values are expressed as picomoles produced per milliliter of lysate and represent averages of duplicate determinations with SD about the means indicated. These data are representative of at least three independent experiments performed in duplicate. (C) Chemical structures of inhibitors KH1 and KH2. (D) Inhibition of purified sAC (circles) or purified tmAC type VII C1 + C2 (squares) by KH1 (open symbols) and KH2 (closed symbols). Values for purified tmAC type VII C1 + C2 represent basal activity, which was significantly above background. Activity values are expressed as picomoles of cAMP produced per minute per milligram of protein and represent averages of duplicate determinations with SD about the means indicated.
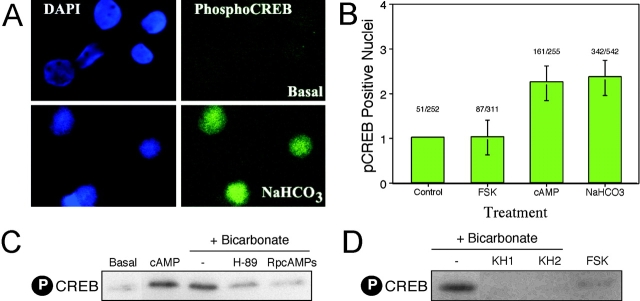
Isolated nuclei contain a bicarbonate-responsive cAMP signaling microdomain dependent on both sAC and PKA. (A and B) Equal aliquots of nuclei-enriched P2 were incubated with 40 mM NaCl (Basal), 10 μM forskolin (FSK), 1 mM 8-Br cAMP (cAMP), or 40 mM of sodium bicarbonate (NaHCO3) for 10 min, smeared on a chilled glass slide, placed at −20°C, and immunostained for CREB family member phosphorylation using phospho-CREB–specific polyclonal antisera (green). (A) Intact nuclei were confirmed by DAPI staining (left). Bottom right highlights representative nuclei considered positive for CREB phosphorylation for quantitation. (B) Three microscopic fields per condition were photographed and counted by a blinded scientist. Values graphed represent the percentage of positive nuclei normalized to Basal (control) averaged from five separate experiments. Ratios above each bar represent the total number of positive nuclei divided by the total number of nuclei counted for all five experiments. (C) Western blot using phospho-CREB–specific antisera against equal aliquots of nuclei-enriched P2 treated with Mg2+-ATP alone (Basal) or substrate in the presence of 1 mM 8-Br cAMP (cAMP), 40 mM bicarbonate, or 40 mM bicarbonate in the presence of either 10 μM H-89 or 1 mM 8-Br-RpcAMPs. Each band was quantitated and normalized to basal; the relative intensities are basal (1 U), cAMP (30 U), bicarbonate alone (−; 27 U), bicarbonate plus H-89 (13 U), and bicarbonate plus Rp-cAMPs (8 U). (D) Western blot using phospho-CREB–specific antisera against equal aliquots of nuclei-enriched P2 treated with 10 μM forskolin (FSK) or with 40 mM of bicarbonate alone (−) or in the presence of either sAC specific inhibitor KH1 (250 μM) or KH2 (100 μM).
References
-
- Alto, N., J.J. Carlisle Michel, K.L. Dodge, L.K. Langeberg, and J.D. Scott. 2002. Intracellular targeting of protein kinases and phosphatases. Diabetes. 51(3):S385–S388. - PubMed
-
- Bacskai, B.J., B. Hochner, M. Mahaut-Smith, S.R. Adams, B.K. Kaang, E.R. Kandel, and R.Y. Tsien. 1993. Spatially resolved dynamics of cAMP and protein kinase A subunits in Aplysia sensory neurons. Science. 260:222–226. - PubMed
-
- Bevensee, M.O., S.L. Alper, P.S. Aronson, and W.F. Boron. 2000. Control of intracellular pH. The Kidney. Vol. I. D.W. Seldin and G. Giebisch, editors. Lippincott Williams & Wilkins, Philadelphia, PA. 391–442.
