. 2004 Feb 17;101(7):2173-8.
doi: 10.1073/pnas.0308512100. Epub 2004 Feb 9.

Incipient Alzheimer's disease: microarray correlation analyses reveal major transcriptional and tumor suppressor responses

Affiliations

Incipient Alzheimer's disease: microarray correlation analyses reveal major transcriptional and tumor suppressor responses

Eric M Blalock et al. Proc Natl Acad Sci U S A. .

Abstract

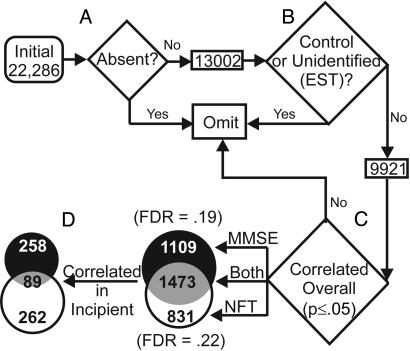
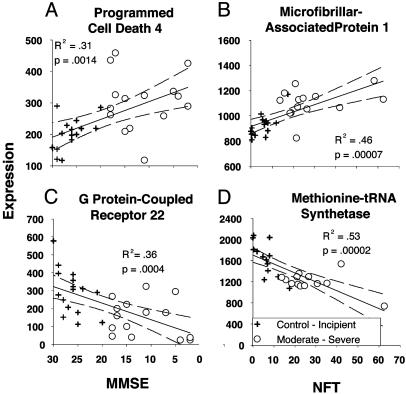
The pathogenesis of incipient Alzheimer's disease (AD) has been resistant to analysis because of the complexity of AD and the overlap of its early-stage markers with normal aging. Gene microarrays provide new tools for addressing complexity because they allow overviews of the simultaneous activity of multiple cellular pathways. However, microarray data interpretation is often hindered by low statistical power, high false positives or false negatives, and by uncertain relevance to functional endpoints. Here, we analyzed hippocampal gene expression of nine control and 22 AD subjects of varying severity on 31 separate microarrays. We then tested the correlation of each gene's expression with MiniMental Status Examination (MMSE) and neurofibrillary tangle (NFT) scores across all 31 subjects regardless of diagnosis. These well powered tests revealed a major transcriptional response comprising thousands of genes significantly correlated with AD markers. Several hundred of these genes were also correlated with AD markers across only control and incipient AD subjects (MMSE > 20). Biological process categories associated with incipient AD-correlated genes were identified statistically (ease program) and revealed up-regulation of many transcription factor/signaling genes regulating proliferation and differentiation, including tumor suppressors, oligodendrocyte growth factors, and protein kinase A modulators. In addition, up-regulation of adhesion, apoptosis, lipid metabolism, and initial inflammation processes occurred, and down-regulation of protein folding/metabolism/transport and some energy metabolism and signaling pathways took place. These findings suggest a new model of AD pathogenesis in which a genomically orchestrated up-regulation of tumor suppressor-mediated differentiation and involution processes induces the spread of pathology along myelinated axons.


Figures

Fig. 1.
Fig. 1.
Gene identification algorithm. (A) Genes rated absent (see Methods) were excluded from analysis. (B) Only annotated probe sets (not expressed sequence tags) were included in the statistical analysis. (C) Pearson correlation was performed for every gene against both MMSE and NFT measures of each subject. Venn diagram shows the number of genes significantly correlated (P ≤ 0.05) with both MMSE and NFT or either index alone. For each index, the false discovery rate (FDR) was calculated. (D) For the genes found to correlate significantly across all subjects (overall, n = 31), another Pearson's correlation was performed post hoc among only the subjects rated either “Control” or “Incipient” (Incipient, n = 16).
Fig. 2.
Fig. 2.
Examples of correlated genes illustrating the four directions of correlation through which genes were identified. For each gene, expression intensity is plotted on the y axis, and MMSE (A Left and C Left) or NFT (B Right and D Right) scores are plotted on the x axis; R2 value, P value (Pearson's test), linear fit (black line), and 95% confidence intervals (dashed lines) are also shown. The MMSE scale is reversed, so that more advanced AD increases to the right on both indexes. (A and B) Genes for which expression levels were up-regulated with AD, identified by negative or positive correlation with MMSE (A) or NFT (B) scores, respectively. (C and D) Genes for which expression levels were down-regulated with AD, identified by positive or negative correlation with MMSE (C) or NFT (D), respectively.
Fig. 3.
Fig. 3.
Schematic model. In this model, OGs are activated either by damage to myelin (asterisks in red) or by endogenous deregulation, resulting in GF production and remyelination (lipogenic) growth responses. GFs from OGs trigger oligodendrocyte progenitor (OGP) cells to divide, but they also reach other cell types through extracellular space and perhaps through the myelin sheath into axons and adjacent OGs. Excess GFs from OGs trigger TS pathways specific to various brain cell types, which, in turn, induce unfavorable ECM changes by astroglia (A), proinflammatory cytokines (INF) from microglia (MG) and astroglia, and repression of protein synthesis (PS) in neurons (N). These TS responses impair axonal protein transport, induce axonal retraction, activate additional remyelination programs, and culminate in NFTs and, perhaps, altered amyloid precursor protein processing. This process begins in the entorhinal cortex and spreads sequentially through adjacent OGs (1-4) along myelinated axons to the hippocampus and neocortex.

References

    1. Tanzi, R. E. & Bertram, L. (2001) Neuron 32, 181-184. - PubMed
    1. Klein, W. L., Krafft, G. A. & Finch, C. E. (2001) Trends Neurosci. 24, 219-224. - PubMed
    1. Hardy, J. & Selkoe, D. J. (2002) Science 297, 353-356. - PubMed
    1. Price, D. L. & Sisodia, S. S. (1998) Annu. Rev. Neurosci. 21, 479-505. - PubMed
    1. Mucke, L., Masliah, E., Yu, G. Q., Mallory, M., Rockenstein, E. M., Tatsuno, G., Hu, K., Kholodenko, D., Johnson-Wood, K. & McConlogue, L. (2000) J. Neurosci. 20, 4050-4058. - PMC - PubMed

Publication types

Substances