. 2004 Feb 17;101(7):2011-6.
doi: 10.1073/pnas.0400148101. Epub 2004 Feb 9.

Arthritis suppressor genes TIA-1 and TTP dampen the expression of tumor necrosis factor alpha, cyclooxygenase 2, and inflammatory arthritis

Affiliations

Arthritis suppressor genes TIA-1 and TTP dampen the expression of tumor necrosis factor alpha, cyclooxygenase 2, and inflammatory arthritis

Kristine Phillips et al. Proc Natl Acad Sci U S A. .

Abstract

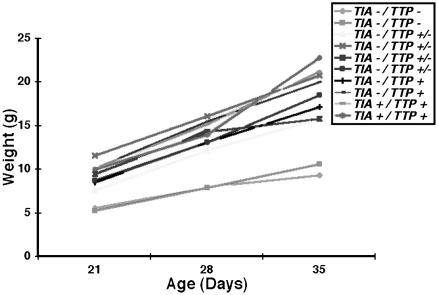
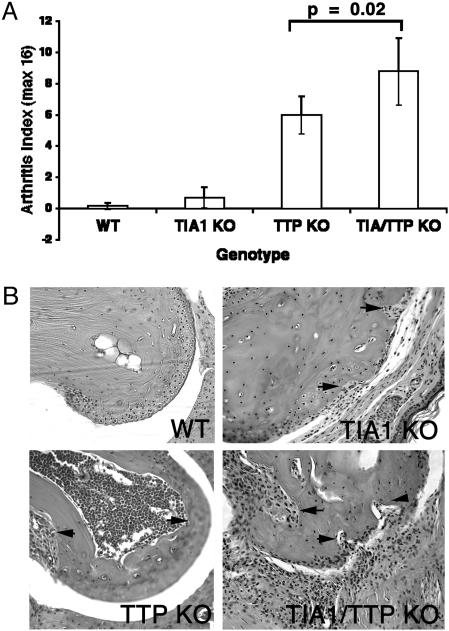
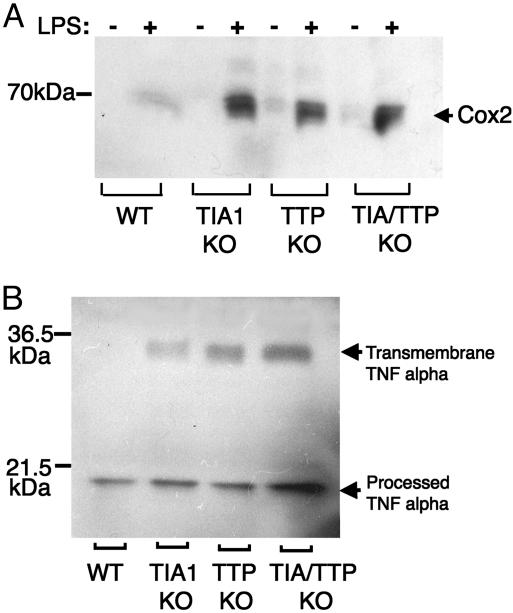
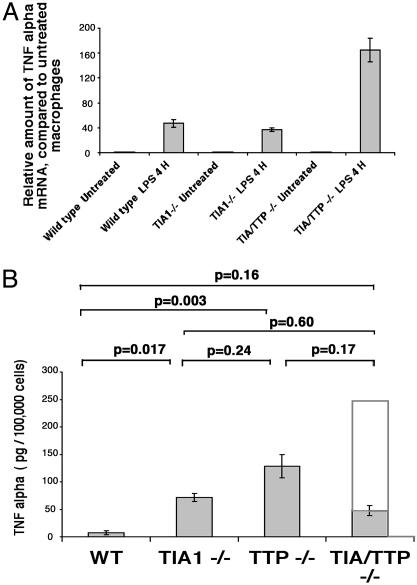
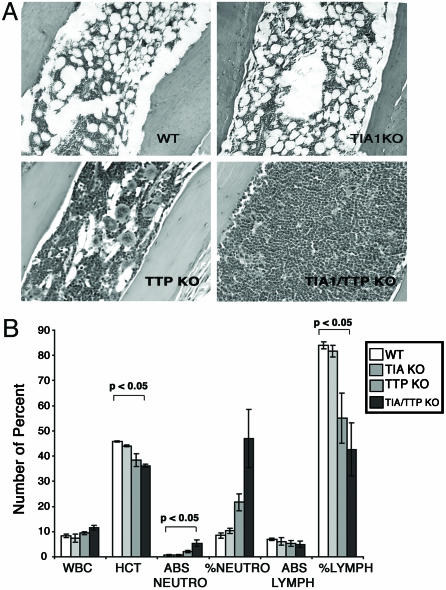
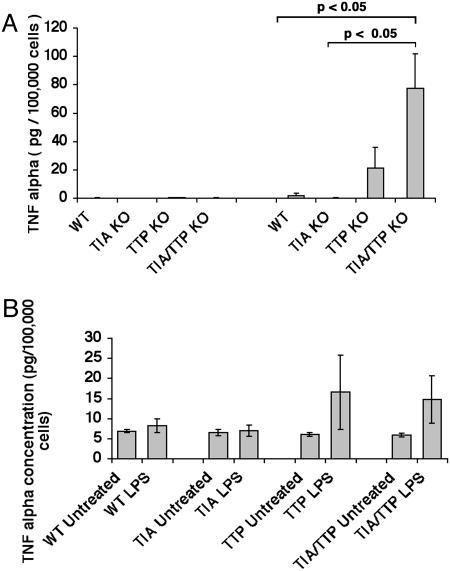
TIA-1 and TTP are AU-rich element-binding proteins that prevent the pathological overexpression of tumor necrosis factor alpha (TNF-alpha). TIA-1 inhibits the translation of TNF-alpha transcripts, whereas TTP promotes the degradation of TNF-alpha transcripts. Here we show that TIA-1 and TTP function as arthritis suppressor genes: TIA-1(-/-) mice develop mild arthritis, TTP(-/-) mice develop severe arthritis, and TIA-1(-/-)TTP(-/-) mice develop very severe arthritis. Peritoneal macrophages derived from all three genotypes overexpress cyclooxygenase 2 and TNF-alpha. Surprisingly, lipopolysaccharide-activated TIA-1(-/-)TTP(-/-) macrophages secrete less TNF-alpha protein than either TIA-1(-/-) or TTP(-/-) macrophages. In these mice, arthritogenic cytokine may be produced by neutrophils that accumulate in the bone marrow and peripheral blood. Our results suggest that TIA-1 and TTP are genetic modifiers of inflammatory arthritis that can alter the spectrum of cells that produce arthritogenic cytokines.


Figures

Fig. 1.
Fig. 1.
Growth curves for wild-type and knockout mice. TIA-1/TTP nullizygous mice are smaller than wild-type or TTP+/– mice at birth and exhibit delayed growth.
Fig. 2.
Fig. 2.
Arthritis severity in wild-type and mutant mice. (A) Arthritis index. Wild-type, TIA-1–/–, TTP–/–, and TIA-1–/–/TTP–/– adult mice were blindly assessed for arthritis severity and were assigned a score based on the arthritis index described in Materials and Methods. Data show the means ± SE from 12 mice of each genotype. (B) Histologic assessment of arthritis. Shown is a hematoxylin/eosin stain of proximal interphalangeal joint from the front paw from the indicated genotype. (Magnification, ×20.) All histologic assessments were determined by using age-matched mice (6 months old). (Upper Left) Wild type (WT). (Upper Right) TIA-1–/– (TIA1 KO). Arrows indicate bone erosion from the articular surface. (Lower Left) TTP–/– (TTP KO). Arrows indicate hypercellular bone marrow with osteoclastogenic activation in the marrow space. (Lower Right) TIA-1–/–/TTP–/– (TIA1/TTP KO) mice. Arrows indicate thickened inflamed synovium with bone erosion from the articular surface.
Fig. 3.
Fig. 3.
Expression of COX-2 and TNF-α in LPS-activated peritoneal macrophages. (A) Peritoneal macrophages (derived from wild-type, TIA-1–/–, TTP–/–, and TIA-1/TTP–/– mice) were cultured in the absence (–) or presence (+) of LPS (1 μg/ml for 4 h) before processing for Western blot analysis using antibodies reactive with COX-2. (B) LPS-activated macrophages of the indicated genotypes were processed for Western blot analysis by using antibodies reactive with TNF-α. The relative migration of molecular mass markers is shown at the left.
Fig. 4.
Fig. 4.
Expression of TNF-α mRNA and protein in LPS-activated peritoneal macrophages. (A) Quantitation of TNF-α mRNA using real-time PCR. Total cellular mRNA was extracted from LPS-activated peritoneal macrophages (derived from wild-type, TIA-1–/–, TTP–/–, and TIA-1–/–/TTP–/– mice) using the TRIzol method. TNF-α RNA and 18S rRNA were quantitated by using real-time PCR. The expression of TNF-α mRNA was normalized to 18S rRNA and is shown in arbitrary units. Pooled RNA from three mice was subjected to RT-PCR. Data show the average of two independent analyses. (B) Quantitation of TNF-α protein using ELISA. Supernatants from LPS-activated peritoneal macrophages derived from 12 wild-type, 10 TIA-1–/–, 5 TTP–/–, and 12 TIA-1/TTP–/– mice were assayed for soluble TNF-α. Each bar shows the mean secretion ± SE. The open bar in the TIA-1–/–/TTP–/– sample depicts the expected production of TNF-α if the effects of TIA-1 and TTP were additive.
Fig. 5.
Fig. 5.
Quantitation of bone marrow and peripheral blood neutrophils. (A) Bone marrow histology. All histologic assessments were determined by using age-matched mice (4–6 months old). Bone marrow from wild-type, TIA-1–/–, TTP–/–, and TIA-1–/–/TTP–/– mice was analyzed by hematoxylin/eosin staining. (B) Peripheral blood counts from wild-type, TIA-1–/–, TTP–/–, and TIA-1–/–/TTP–/– mice shows total white blood count (WBC), hematocrit (HCT), absolute neutrophil count (ABS NEUTRO), percent of neutrophils (% NEUTRO), absolute lymphocyte count (ABS LYMPH), and percent of lymphocytes (% LYMPH). Data are the means and SE from three different mice. Statistical analysis (P < 0.05) compares wild-type and TIA-1–/–/TTP–/– mice.
Fig. 6.
Fig. 6.
Production of TNF-α by bone marrow cells and bone marrow-derived Gr-1+ neutrophils. (A) Supernatants harvested from LPS-activated bone marrow cells derived from wild-type, TIA-1–/–, TTP–/–, and TIA-1–/–/TTP–/– mice were assayed for TNF-α by using an ELISA. Data depict the means and SE from three independent experiments. (B) Percoll gradient-enriched, bone marrow-derived Gr-1+ neutrophils from wild-type, TIA-1–/–, TTP–/–, and TIA-1–/–/TTP–/– female mice were activated with LPS (1 μg/ml for 4 h) before harvesting supernatants for quantitation of TNF-α using an ELISA. Data depict the means and SE from three independent experiments.

References

    1. Cope, A., Aderka, D., Doherty, M., Englemann, H., Gibbons, D., Jones, A., Brennan, F., Maini, R., Wallach, D. & Feldmann, M. (1992) Arthritis Rheum. 35, 1160–1169. - PubMed
    1. Feldmann, M. & Maini, R. N. (2002) Joint Bone Spine 69, 12–18. - PubMed
    1. Gravallese, E., Galson, D., Goldring, S. & Auron, P. (2001) Arthritis Res. 3, 6–12. - PMC - PubMed
    1. Brennan, C. M. & Steitz, J. A. (2001) Cell Mol. Life Sci. 58, 266–277. - PMC - PubMed
    1. Dreyfuss, G., Kim, V. N. & Kataoka, N. (2002) Nat. Rev. Mol. Cell Biol. 3, 195–205. - PubMed

Publication types

MeSH terms