. 2004 Feb 9;32(3):902-15.
doi: 10.1093/nar/gkh235. Print 2004.

Inhibitors of protein synthesis identified by a high throughput multiplexed translation screen

Affiliations

Inhibitors of protein synthesis identified by a high throughput multiplexed translation screen

Olivia Novac et al. Nucleic Acids Res. .

Abstract

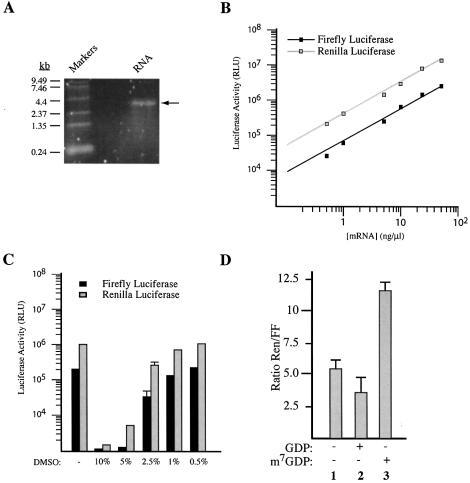
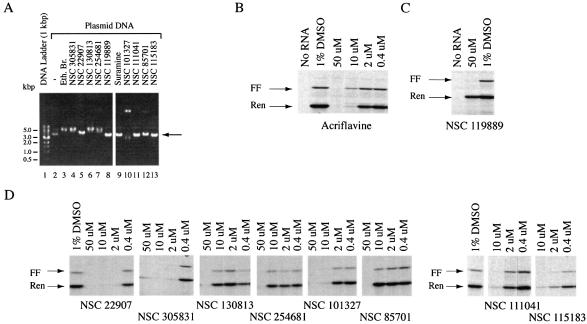
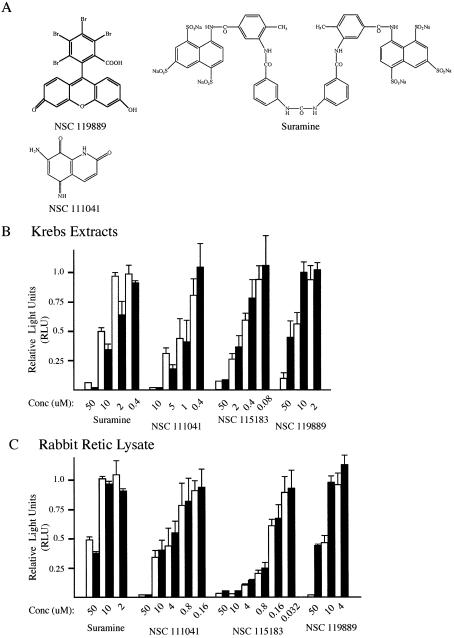
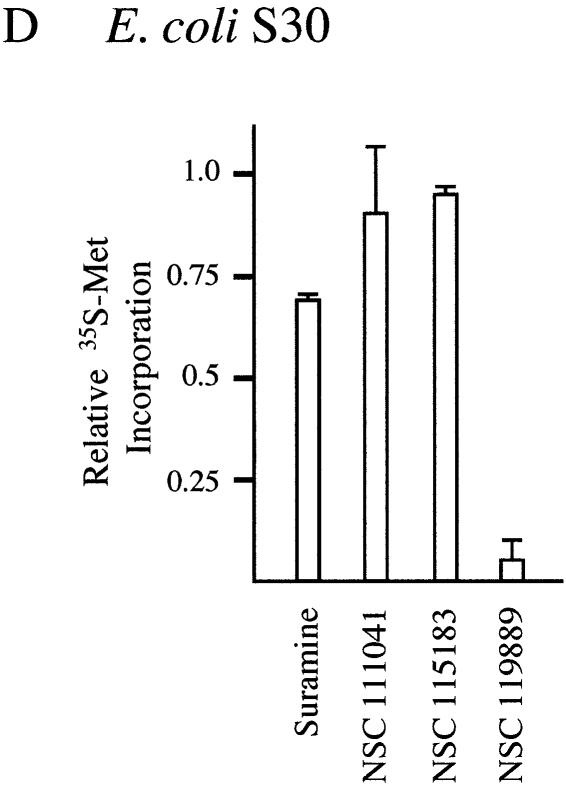
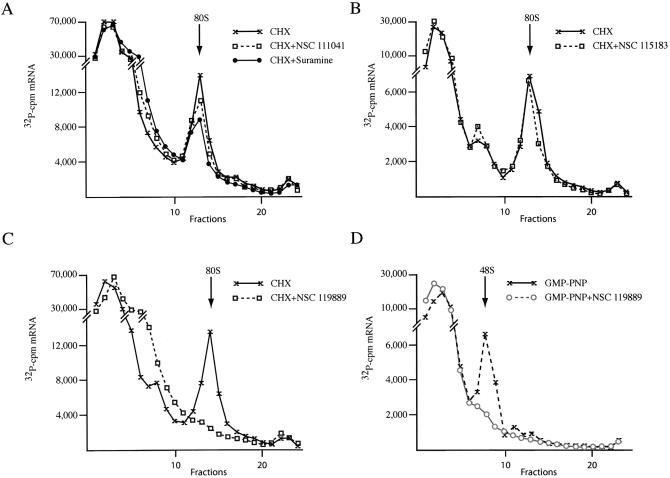
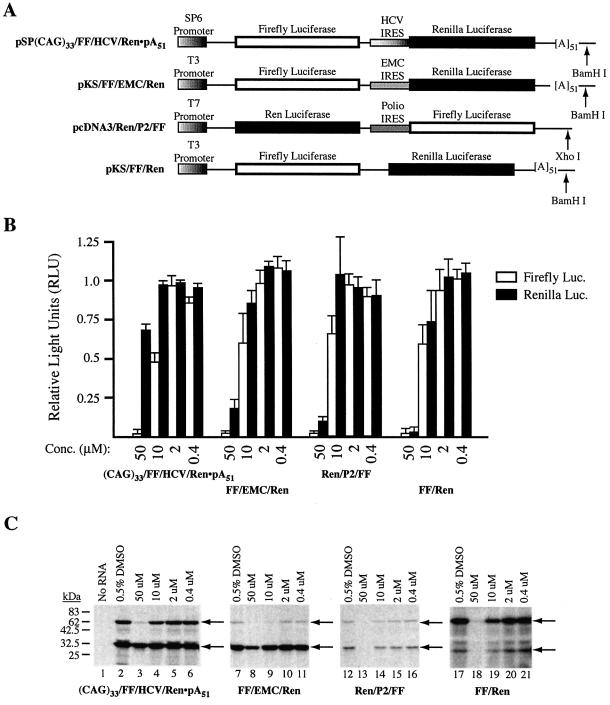
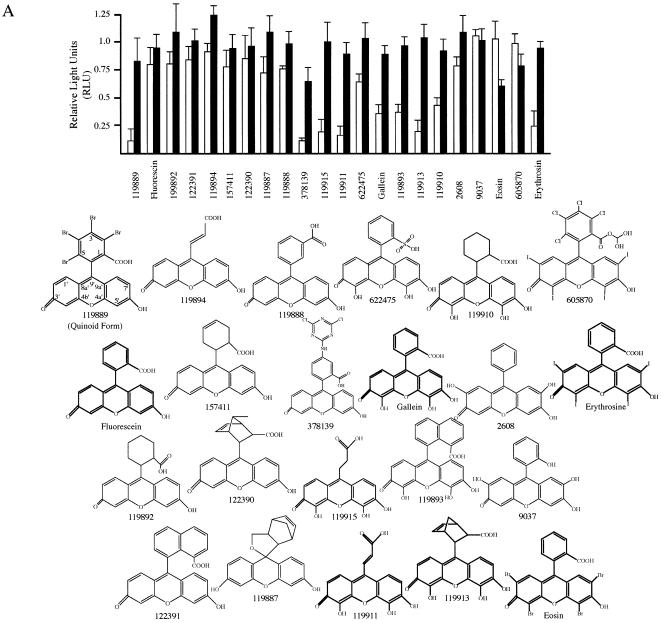
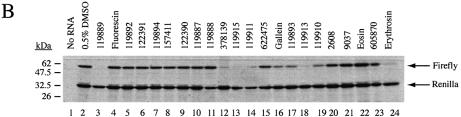
The use of small molecule inhibitors of cellular processes is a powerful approach to understanding gene function that complements the genetic approach. We have designed a high throughput screen to identify new inhibitors of eukaryotic protein synthesis. We used a bicistronic mRNA reporter to multiplex our assay and simultaneously screen for inhibitors of cap-dependent initiation, internal initiation and translation elongation/termination. Functional screening of >90 000 compounds in an in vitro translation reaction identified 36 inhibitors, 14 of which are known inhibitors of translation and 18 of which are nucleic acid-binding ligands. Our results indicate that intercalators constitute a large class of protein synthesis inhibitors. Four non-intercalating compounds were identified, three of which block elongation and one of which inhibits initiation. The novel inhibitor of initiation affects 5' end-mediated initiation, as well as translation initiated from picornaviral IRESs, but does not significantly affect internal initiation from the hepatitis C virus 5'-untranslated region. This compound should be useful for delineating differences in mechanism of initiation among IRESs.


Figures

Figure 1
Figure 1
Outline of the strategy used to multiplex the high throughput search for inhibitors of protein synthesis. (A) In the configuration of the assay, a bicistronic mRNA is used in which initiation can occur at the 5′ end via a cap-dependent mechanism, as well as internally via an internal ribosome entry site (IRES). The firefly (FF) luciferase gene is the first shaded box and the renilla (Ren) luciferase is the second black box. The hepatitis C virus (HCV) IRES is denoted by a thickened line. The plasmid is prepared for in vitro transcription by linearizing with BamHI. Translation initiation of renilla luciferase is driven by the HCV IRES. The position of 33 CAG nucleotide triplets upstream of the firefly luciferase initiation codon is denoted. Inhibition of translation in a cell-free translation extract by a small molecule ligand can occur at one of five sites: by interfering with cap-dependent initiation (Step 1), by interfering with migration of the 40S subunit along the 5′-UTR of the mRNA (Step 2), by inhibiting elongation (Step 3), by inhibiting termination (Step 4) or by inhibiting binding of the 40S subunit to the IRES (Step 5). (B) Predicted secondary structure (ΔG = –38 kcal/mol) formed by the CAG tract within the (CAG)33/FF/HCV/Ren·pA51 5′-UTR using Mfold (48). The bracketed region indicates that this section of the stem is repeated 13 times. (C) Schematic representation of the strategy undertaken to identify novel inhibitors of eukaryotic protein synthesis. See text for details.
Figure 2
Figure 2
Evaluation of the assay format for screening inhibitors of eukaryotic protein synthesis. (A) Formaldehyde/agarose gel analysis of mRNA generated by in vitro transcription of pSP/(CAG)33/FF/HCV/Ren·pA51 linearized with BamHI. In vitro transcriptions were performed as described previously (17). RNA was fractionated on a 1.2% agarose/formaldehyde gel and visualized by staining with SYBR gold (Molecular Probes). The RNA markers are from Gibco BRL and the arrow denotes the position of migration of full-length RNA. (B) Titration of (CAG)33/FF/HCV/Ren·pA51 mRNA into Krebs translation extracts. Both axes are drawn to log scale. Experiments were performed in duplicate and the error of the mean is too small to be visualized. (C) Sensitivity of Krebs extract to DMSO utilizing (CAG)33/FF/HCV/Ren·pA51 mRNA (5 ng/ml). Experiments were performed in duplicate and the error of the mean is shown. (D) Translation in Krebs extracts is cap dependent. Translations were performed in Krebs extracts with (CAG)33/FF/HCV/Ren·pA51 mRNA (5 ng/ml) alone (lane 1), in the presence of 500 µM GDP (lane 2) or with 500 µM m7GDP (lane 3). The ratio of renilla to firefly luciferase is plotted on the ordinate. Experiments were performed in duplicate and the error of the mean is shown. The absolute RLU obtained in the control experiments (lane 1) was 249 022 and 451 008 (for luciferase) and 1 259 448 and 2 630 247 (for renilla).
Figure 3
Figure 3
(A) Intercalation assay assessing the ability of compounds to alter the mobility of supercoiled plasmid DNA. Supercoiled plasmid DNA was incubated with 50 µM ligand at room temperature for 20 min and electrophoresed into a 0.8% agarose gel. The gel was stained with ethidium bromide (0.5 µg/ml) and visualized using short wavelength UV light. The identity of the compounds incubated with supercoiled DNA is indicated above the panel. The position of migration of supercoiled DNA is indicated by an arrow. (BD) Relative production of firefly and renilla by translation of (CAG)33/FF/HCV/Ren·pA51 mRNA in the presence of small molecule ligands. Following in vitro translations, [35S]methionine-labeled samples were treated in SDS sample buffer and electrophoresed into a 10% SDS–polyacrylamide gel. The gels were treated with EN3Hance, dried and exposed to X-Omat (Kodak) film. The concentration of compound used in the translation mix is indicated above the panel and the identity of the compound indicated below the panel. The position of migration of firefly and Renilla luciferase protein are indicated.
Figure 4
Figure 4
(A) Structures of NSC 119889, NSC 111041 and suramine. The structure of NSC 115183 is currently not available. (B) Titration of compounds in Krebs extracts. Translations were performed in the presence of the indicated amounts of compound and at final mRNA and K+ concentrations of 5 µg/ml and 100 mM, respectively. Control translation reactions contained 0.5% DMSO, which is equivalent to what was present in reactions containing compound. Luciferase values are normalized to the activity obtained in the control translations (which were set to 1). The relative firefly luciferase values are represented by white bars and the relative renilla values are represented by black bars. Translations were performed three times and the average values are presented along with the error of the mean. (C) Titration of compounds in rabbit reticulocyte lysate. The relative firefly luciferase values are represented by white bars and the relative renilla values are represented by black bars. Translations were performed twice and the average values are presented along with the error of the mean. (D) Effect of compounds (50 µM) on translation in E.coli S30 extracts. Protein synthesis was monitored by assessing the amount of [35S]methionine incorporation into TCA-precipitable material by endogenous mRNA. Translations were performed twice and the average values are presented along with the error of the mean.
Figure 4
Figure 4
(A) Structures of NSC 119889, NSC 111041 and suramine. The structure of NSC 115183 is currently not available. (B) Titration of compounds in Krebs extracts. Translations were performed in the presence of the indicated amounts of compound and at final mRNA and K+ concentrations of 5 µg/ml and 100 mM, respectively. Control translation reactions contained 0.5% DMSO, which is equivalent to what was present in reactions containing compound. Luciferase values are normalized to the activity obtained in the control translations (which were set to 1). The relative firefly luciferase values are represented by white bars and the relative renilla values are represented by black bars. Translations were performed three times and the average values are presented along with the error of the mean. (C) Titration of compounds in rabbit reticulocyte lysate. The relative firefly luciferase values are represented by white bars and the relative renilla values are represented by black bars. Translations were performed twice and the average values are presented along with the error of the mean. (D) Effect of compounds (50 µM) on translation in E.coli S30 extracts. Protein synthesis was monitored by assessing the amount of [35S]methionine incorporation into TCA-precipitable material by endogenous mRNA. Translations were performed twice and the average values are presented along with the error of the mean.
Figure 5
Figure 5
Effect of compounds on initiation complex assembly in rabbit reticulocyte lysates. 32P-labeled CAT mRNA was incubated in rabbit reticulocyte lysates and initiation complexes resolved by centrifugation on sucrose gradients. Fractions from each sucrose gradient were collected using a Brandel Tube Piercer connected to an ISCO fraction collection and were individually counted. (A) Complex formation in the presence of 600 µM cycloheximide, 600 µM cycloheximide and 50 µM NSC 111041 or 600 µM cycloheximide and 50 µM suramine. The total counts recovered and the percentage mRNA bound to 80S complexes were: CAT mRNA/cycloheximide (320 856 c.p.m., 6% binding); CAT mRNA/cycloheximide + NSC 111041 (304 285c.p.m., 6% binding); CAT mRNA/cycloheximide + suramine (315 307 c.p.m., 3% binding). (B) Complex formation in the presence of 600 µM cycloheximide and 50 µM NSC 115183. The total counts recovered and the percentage mRNA bound to 80S complexes were: CAT mRNA/cycloheximide (109 065 c.p.m., 10% binding); CAT mRNA/cycloheximide + NSC 115183 (112 299 c.p.m., 9% binding). (C) Complex formation in the presence of 600 µM cycloheximide and 50 µM NSC 119889. The total counts recovered and the percentage mRNA bound to 80S complexes were: CAT mRNA/cycloheximide (182 569 c.p.m., 7% binding); CAT mRNA/cycloheximide + NSC 119889 (286 708 c.p.m., 0% binding). (D) Complex formation in the presence of 1 mM 5′-guanylylimidodiphosphate (GMP-PNP) or 1 mM GMP-PNP and 50 µM NSC 119889. Total counts recovered from each gradient and the percentage mRNA bound to 43S complexes were: CAT mRNA/GMP-PNP (98 359 c.p.m., 7% binding); CAT mRNA/GMP-PNP + NSC 119889 (95 225 c.p.m., 0% binding).
Figure 6
Figure 6
(A) Schematic representation of constructs used to assess the inhibitory potential of NSC 119889 on different IRESs. The names of the plasmids harboring the inserts is provided to the left and the restriction sites used to linearize the plasmids denoted to the right. Note that mRNA derived from pKS/FF/Ren, pSP(CAG)33/FF/HCV/Ren·pA51 and pKS/FF/EMC/Ren will contain a poly(A) tail of 51 adenylate residues. (B) Relative translational efficiencies obtained in Krebs extracts programmed with FF/Ren, (CAG)33/FF/HCV/Ren, FF/EMC/Ren and Ren/P2/FF mRNA in the presence of NSC 119889. Control translation reactions contained 0.5% DMSO. Luciferase values were normalized to the activity obtained in the control translations (which were set at one). The relative firefly luciferase values are represented by white bars and the relative renilla values are represented by black bars. The bar represents the average of two experiments and the error of the mean is denoted. (C) A representative experiment demonstrating the relative translation efficiencies of firefly and renilla production from the different test mRNAs in the presence of NSC 119889. Following in vitro translations in Krebs extracts in the presence of [35S]methionine, the indicated amounts of NSC 119889 and 5 ng/ul mRNA, samples were treated in SDS sample buffer and electrophoresed into 10% SDS–polyacrylamide gels. Gels were treated with EN3Hance, dried and exposed to X-Omat (Kodak) film. The concentration of NSC 119889 in the translation reaction is indicated above the panel and the identity of the mRNA used to program the translation reaction is indicated below the panel. The position of migration of firefly and renilla luciferase proteins is denoted. The position of molecular mass markers (NEB) is indicated to the left.
Figure 7
Figure 7
Structure–activity relationships of NSC 119889 analogs. Translations were performed as indicated in Materials and Methods. (A) Effect of 50 µM compound on translation in Krebs extracts programmed with (CAG)33/FF/HCV/Ren mRNA. Luciferase values were normalized to the activity obtained in the control translations (which were set to 1). Experiments were performed three times with each compound and the error of the mean is indicated. The chemical structures are shown below the bar graph. (B) A representative experiment demonstrating the relative translation efficiencies of firefly and renilla production from (CAG)33/FF/HCV/Ren mRNA in the presence of the different NSC analogs. Following in vitro translation in Krebs extracts in the presence of [35S]methionine, 50 µM compound, and 5 ng/µl mRNA, samples were treated in SDS sample buffer and electrophoresed into 10% SDS–polyacrylamide gels. Gels were treated with EN3Hance, dried and exposed to X-Omat (Kodak) film. The identity of the compound used in the translation reaction is denoted above the panel. The position of migration of firefly and renilla luciferase proteins is denoted. The position of molecular mass markers (NEB) is indicated to the left.
Figure 7
Figure 7
Structure–activity relationships of NSC 119889 analogs. Translations were performed as indicated in Materials and Methods. (A) Effect of 50 µM compound on translation in Krebs extracts programmed with (CAG)33/FF/HCV/Ren mRNA. Luciferase values were normalized to the activity obtained in the control translations (which were set to 1). Experiments were performed three times with each compound and the error of the mean is indicated. The chemical structures are shown below the bar graph. (B) A representative experiment demonstrating the relative translation efficiencies of firefly and renilla production from (CAG)33/FF/HCV/Ren mRNA in the presence of the different NSC analogs. Following in vitro translation in Krebs extracts in the presence of [35S]methionine, 50 µM compound, and 5 ng/µl mRNA, samples were treated in SDS sample buffer and electrophoresed into 10% SDS–polyacrylamide gels. Gels were treated with EN3Hance, dried and exposed to X-Omat (Kodak) film. The identity of the compound used in the translation reaction is denoted above the panel. The position of migration of firefly and renilla luciferase proteins is denoted. The position of molecular mass markers (NEB) is indicated to the left.

References

    1. Pestka S. (1977) Inhibitors of Protein Synthesis. Academic Press, New York, NY.
    1. Vazquez D. (1979) Inhibitors of protein biosynthesis. Mol. Biol. Biochem. Biophys., 30, 1–312. - PubMed
    1. Watkins S.J. and Norbury,C.J. (2002) Translation initiation and its deregulation during tumorigenesis. Br. J. Cancer, 86, 1023–1027. - PMC - PubMed
    1. Graff J.R. and Zimmer,S.G. (2003) Translational control and metastatic progression: enhanced activity of the mRNA cap-binding protein eIF-4E selectively enhances translation of metastasis-related mRNAs. Clin. Exp. Metastasis, 20, 265–273. - PubMed
    1. Hershey J.W. and Miyamoto,S. (2000) Translation Control and Cancer. Cold Spring Harbor Laboratory Press, Cold Spring Harbor, NY.

Publication types

MeSH terms