

doi: 10.1101/gad.1162404.
Modulation of mammalian life span by the short isoform of p53
Affiliations
- PMID: 14871929
- PMCID: PMC338283
- DOI: 10.1101/gad.1162404
Item in Clipboard
Modulation of mammalian life span by the short isoform of p53
Genes Dev.
.
Abstract
Overexpression of the short isoform of p53 (p44) has unexpectedly uncovered a role for p53 in the regulation of size and life span in the mouse. Hyperactivation of the insulin-like growth factor (IGF) signaling axis by p44 sets in motion a kinase cascade that clamps potentially unimpeded growth through p21Cip1. This suggests that pathways of gene activity known to regulate longevity in lower organisms are linked in mammals via p53 to mechanisms for controlling cell proliferation. Thus, appropriate expression of the short and long p53 isoforms might maintain a balance between tumor suppression and tissue regeneration, a major requisite for long mammalian life span.
Figures
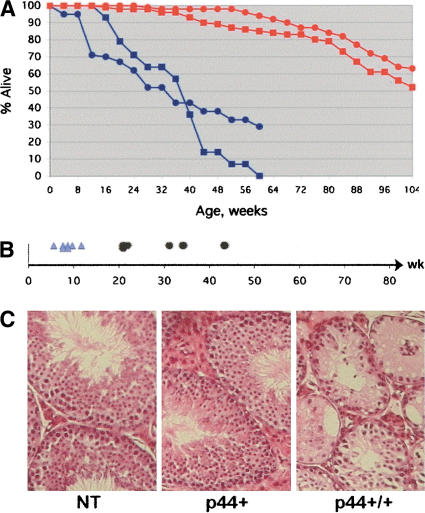
Accelerated aging in p44 transgenic mice. (A) Decreased life span. Survival data are presented for nontransgenic (NT; red) and p44 homozygous transgenic (blue) mice. Males, squares; females, circles. The 50% survival mark was 24 mo for wild-type mice and 8 mo for p44 homozygous mice. (B) Premature loss of fertility. Shortened reproductive period in male p44 transgenic mice. First fertile age for individual mice is indicated by light blue triangles, and last fertile age by black dots. Onset of fertility is normal, but the loss of reproductive capacity before 1 yr of age is premature in males. (C) Testicular degeneration. Histology of the testes of p44 transgenic and NT animals at 9.5 mo of age. H&E-stained sections. Note the widespread degeneration of the seminiferous epithelium and tubule atrophy in P+/+ testis compared to P+ and NT, which are normal.
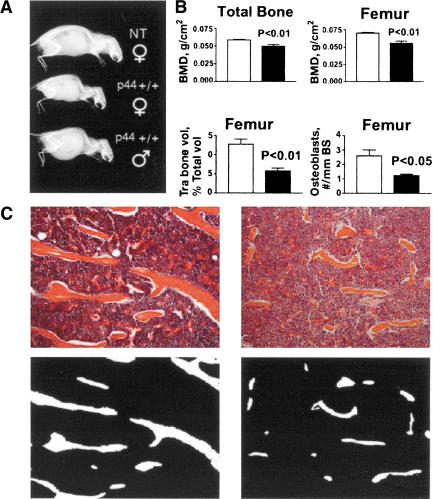
Accelerated bone aging in p44 transgenic mice. (A) Skeletal changes. X-rays of three siblings from the Q line at 5 mo of age. Genotypes and sexes as indicated; ♀, female; ♂, male. Homozygous transgenic mice of both sexes show pronounced lordokyphosis even at this early age. (B) Changes in density and cell number. Bone mineral density (BMD; upper panel), trabecular bone volume (TBV) and osteoblast number (N.Ob/BS; lower panel) in the NT and p44+/+ transgenic mice. p44+/+ mice have lower BMD in total bone and femur (upper panel). Bone histomorphometry data of the femur showed a significant reduction both in TBV and osteoblast number in the p44+/+ mice compared to NT (lower panel). (C) Trabecular bone changes. Upper panel: A representative histological section of the NT and P44+/+ femurs, stained with H&E (original magnification, 100×). Bone trabeculae are much longer and thicker in NT mice (left) compared to P44+/+ mice (right). Lower panel: Bone trabeculae (in white) in binary images of the same histological sections showing more trabecular area in nontransgenic (left) compared to p44+/+ mice.
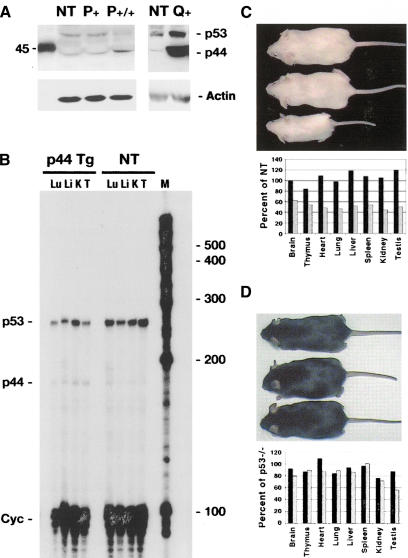
Overexpression of the short isoform of p53 in p44 transgenic mice. (A) p44 protein in transgenic and NT mice. Western blots of 100 μg thymus protein extracted from transgenic (P,Q) and NT (NT) tissues. The anti-p53 polyclonal antiserum CM5 detects both isoforms of p53, as indicated. Biotinylated markers were run alongside the tissue extracts during SDS-PAGE; the marker corresponding to 45 kD is shown. (B) p44 and p53 RNA in transgenic and NT mice. RNAse protection assay was used to detect both p53 (220-bp protected fragment) and p44 (140-bp protected fragment) RNA. Simultaneous hybridization to a probe that detects cyclophilin (Cyc) was used to control for assay conditions. Lu, lung; Li, liver; K, kidney; T, testis; M, marker RNA bands. (C) Effect of p44 on body size. Size of NT (top), hemizygous (middle), and homozygous (bottom) P mice at 3 mo of age. Organ weights of representative hemizygous (black bars) and homozygous (stippled bars) transgenic mice are plotted as a percentage of NT weights. Transgenic animals were generated on a p53+/+ background. (D) Genetic interaction of p44 and p53. Nontransgenic (top), hemizygous (middle), and homozygous (bottom) P mice generated on a p53-/- background. Organ weights of representative hemizygous (black bars) and homozygous (stippled bars) transgenic mice are plotted as a percentage of p53-/- weights.
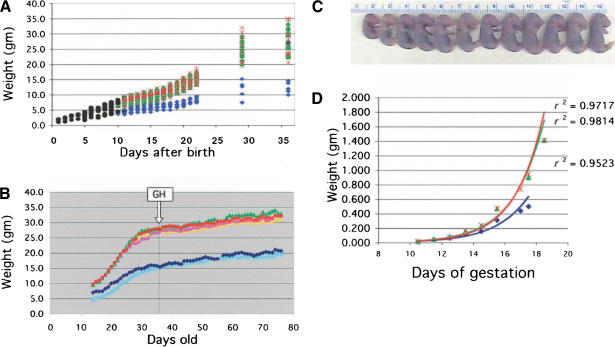
Growth impairment during post- and prenatal development. (A) Postnatal growth. Hemizygous p44 mice were intercrossed to produce animals of each possible genotype. Black circles, genotype unknown; blue diamonds, homozygote; green triangles, hemizygote; red cross, NT. Each symbol represents an individual animal. The pups were weighed daily until weaning, and weekly thereafter. (B) Effect of rGH on postnatal growth. GH treatment was started at week 3 of the study, as indicated by the boxed arrow, and continued for 6 wk. Animals were weighed each day and injected s.c. with either 100 ng/g body weight recombinant growth hormone (rGH) or vehicle. Light blue diamonds, P+/+-GH; dark blue diamonds, P+/+-vehicle; yellow triangles, P+-GH; green triangles, P+-vehicle; pink circles, NT=GH; red circles, NT-vehicle. P+/+, homozygous transgenic; P+, hemizygous transgenic; NT, non-transgenic. (C) Size variation between sibling embryos. Individual size variation at E17.5 in the progeny resulting from a single intercross of p44 hemizygous parents. (D) Prenatal growth. Embryo weight vs. age during the period of fetal growth for individual homozygotes (blue diamonds), hemizygotes (green triangles), and NT embryos (red crosses) resulting from p44 hemizygous intercrosses. Regression curves and their associated coefficients of determination (r2) are superimposed on the data and follow the same color scheme.
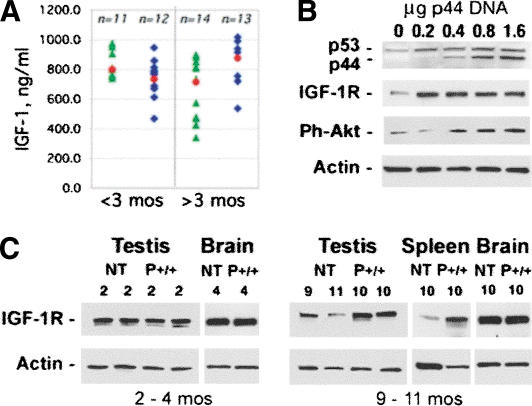
p44 effects on IGF and its receptor. (A) Serum levels of IGF-1: Serum was prepared from retro-orbital cavity blood and subjected to competitive enzyme immunoassay to determine circulating levels of IGF in younger (<3 mo of age) and older (>3 mo of age) mice. Each blue or green symbol represents an individual animal. Blue diamonds, P+/+; green triangles, P+. The mean for each group is indicated by a red circle. (B) IGF-1 receptor expression in tissues. Western blots of 30 μg tissue extracts from young (2-4 mo) or old (9-11 mo) NT or p44 homozygous (P+/+) mice were probed with an antibody against the IGF-1 receptor (IGF-1R). Shown are representative samples of testis, brain, and spleen, with the genotypes and ages of each animal indicated above the lane with the corresponding protein extract. (C) IGF-1 receptor expression in response to increasing dose of p44 DNA. Mouse embryonic cells derived from NT mice were transfected with 0-1.6 μg pE44-1 plasmid DNA and grown for 24 h in 1% FCS. Cells were then switched to 0% for 3 h and treated for 15 min with rhIGF-1 or left untreated. Protein extracts (30 μg) were subjected to SDS-PAGE, and Western blots were probed with antibodies against the IGF-1R and phospho-Akt (Ser473). Cytoplasmic actin was used as a loading control.
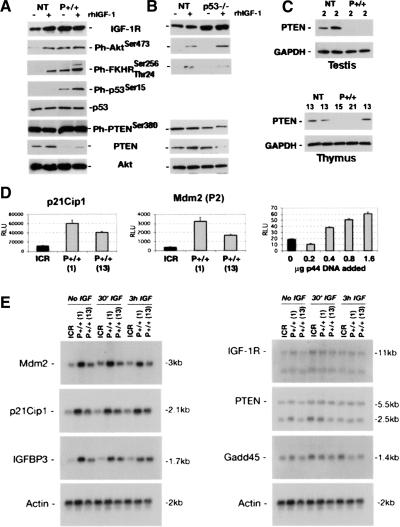
Altered expression of IGF signaling molecules in p44 cells and tissues. (A) IGF-1 receptor expression in embryonic cells. Cells were grown as described in the text. NT cells respond to rhIGF-1 with an increase in receptor level. In p44 homozygous cells (P+/+), the receptor level is high even in the absence of added ligand. Increased IGF-1R activity is transduced to downstream targets, including Akt (Ph-Akt), forkhead (Ph-FKHR), and p53 itself (Ph-p53). PTEN is affected at both the total protein and phosphorylated protein levels. Total Akt levels were used as a loading control. (B) Effect of p53 null background on IGF-1 signaling. Same conditions as above, but with cells derived from p53-/- embryos. Compared to wild-type (NT), the level of phosphorylated Akt is higher in p53 null cells when IGF was added to the culture medium, which is similar to what was observed in p44 cells. In contrast, there was no hyperactivation of FKHR, which is actually lower in p53 null cells than in wild-type cells. (C) Expression of PTEN in tissues. Protein extracts (30 μg) from testis or thymus of individual mice were subjected to SDS-PAGE and Western blots probed with anti-PTEN or -GAPDH antibodies. GAPDH was used as a loading control. Ages and genotypes are indicated above each lane. The thymus extracts were all from females. (D) Luciferase reporter assays of p53 trans-activation function. Cells were transfected with the p21Cip1-luciferase reporter (p21Cip1) or Mdm2(P2)-luciferase [Mdm2(P2)] reporters and assayed for luciferase activity after 24 h in medium containing 1% FCS. MEFs from two different P+/+ embryos (labeled 1 and 13) or from NT embryos (labeled ICR) were used. In the right panel, only NT MEFs were used, and were transfected with increasing amounts of p44 DNA, as described in the Figure 5C legend. The resultant levels of p53/p44 in this experiment were assayed by Western blot and are shown in Figure 5C (uppermost panel). (E) Northern analysis of p53 target gene expression. Cells were grown in the absence of IGF-1 (No IGF), in the presence of IGF-1 during the last 30 min of culture (30′ IGF), or for 3 h with IGF-1 (3h IGF). Total RNA (9 μg) was subjected to denaturing gel electrophoresis, blotted, and hybridized to radioactive cDNA probes. Left panel: Targets demonstrating increased expression with overexpression of p44. Right panel: Targets demonstrating compromised p53 function with overexpression of p44. Rehybridization with a probe for β-actin (bottom) was used to control for any loading differences.
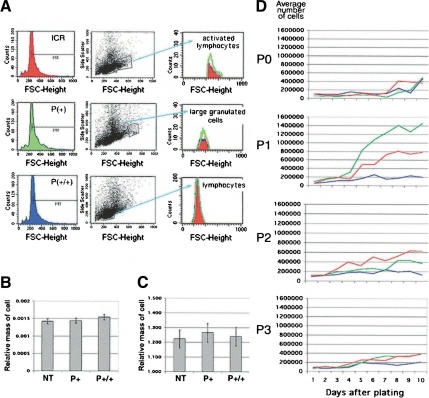
p44 effects on cell size and cell number. (A) Lymphocytes. Relative sizes of gated subpopulations of a total of 20,000 spleen cells determined in forward scatter mode by FACS. Histograms of cell counts in populations of activated lymphocytes (top), large granulated cells (middle), and immature lymphocytes (bottom) are color-coded by genotype: red, NT splenocytes; green, hemizygous splenocytes; blue, homozygous splenocytes. (B) Testis. Relative mass of spermatocytes at 3 wk of age, as determined by image analysis. See Materials and Methods for details. (C) Liver. Relative area of cells from adult liver, as determined by image analysis. See Materials and Methods for details. (D) Embryonic cell proliferation. Assays were performed at successive passages with cells derived from E12.5-14 embryos. Shown is a plot of average cell counts over the 10-d period for cultures derived from NT (red), hemizygous (green), and homozygous (blue) embryos at P0, P1, P2, and P3. P0 were primary cells that had not been cultured for any length of time prior to the assay. Shown is one set of assays; identical results were obtained with cells from at least two different embryos of each genotype. Hemizygous cells consistently proliferated at a higher rate than NT cells at P1. See the discussion of the IGF-R in the text for an explanation.
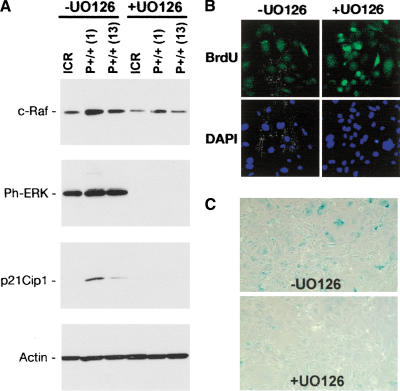
Effect of ERK activation on proliferation and senescence. (A) Ras-Raf-MEK-ERK effects in MEFs. Western blots of protein extracts (30 μg) from cells grown in the absence (-) or presence (+) of UO126, a pharmacological blocker of the ERK kinases, MEK1/2. ICR, cells from NT embryo; P+/+ (1) and P+/+ (13), cells from two different p44 homozygous embryos. (B) Recovery of proliferation in p44 homozygous MEFs by pharmacological blockade of ERK. Cells were grown for 48 h in 10 mM UO126 and pulsed for 1 h with BrdU. After fixation, cells were stained with antibody G3G4 against BrdU (green, top panels) to identify nuclei synthesizing DNA and with DAPI (blue, bottom panels) to identify all cell nuclei. Original magnification, 40×. Images were captured digitally and manipulated using Adobe Photoshop, v.7. (C) Reduced cellular senescence in p44 homozygous MEFs by pharmacological blockade of ERK. Cells were subjected to SA-β-gal assay following culture in the absence or presence of UO126, as described above.
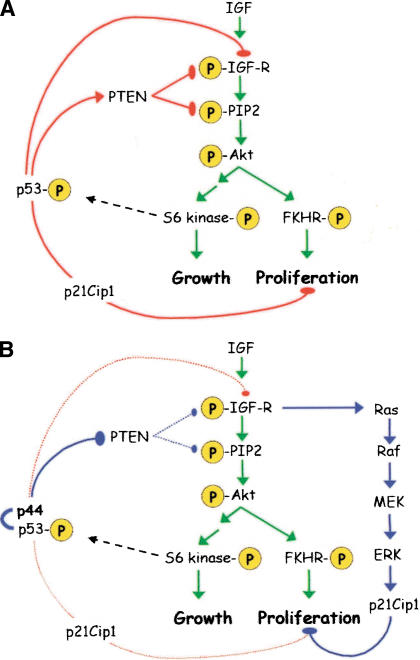
A model for the regulation of IGF signaling by p53. (A) Hierarchy of IGF control in normal cells. Major phosphorylation events that occur upon ligand binding are indicated by the “P”s circled in yellow and are connected by green arrows. The pathway bifurcates at Akt/PKB into an FKHR-dependent proliferation branch (right) and a TOR/S6 kinase-dependent anabolic branch (left). p53 exerts several layers of control over the first steps of the cascade (solid red arrows), but also has a fail-safe mechanism of control via p21 late in the cascade (dotted red arrow). (B) Disruption of IGF control by p44. The interaction of p44 with p53 results in permanent activation of the IGF-R, simultaneously triggering growth via the IGF pathway (green arrows) and cell-cycle arrest via Ras (blue arrows).
References
-
- Bluher M., Kahn, B.B., and Kahn, C.R. 2003. Extended longevity in mice lacking the insulin receptor in adipose tissue. Science 299: 572-574. - PubMed
-
- Clancy D.J., Gems, D., Harshman, L.G., Oldham, S., Stocker, H., Hafen, E., Leevers, S.J., and Partridge, L. 2001. Extension of life-span by loss of CHICO, a Drosophila insulin receptor substrate protein. Science 292: 104-106. - PubMed
Publication types
MeSH terms
Substances
Grants and funding
LinkOut - more resources
Full Text Sources
Other Literature Sources
Molecular Biology Databases
Research Materials
Miscellaneous