Comparative Study
. 2004 Feb 11;32(3):977-88.
doi: 10.1093/nar/gkh258. Print 2004.

The genome sequence of Bacillus cereus ATCC 10987 reveals metabolic adaptations and a large plasmid related to Bacillus anthracis pXO1

Affiliations
Comparative Study

The genome sequence of Bacillus cereus ATCC 10987 reveals metabolic adaptations and a large plasmid related to Bacillus anthracis pXO1

David A Rasko et al. Nucleic Acids Res. .

Abstract

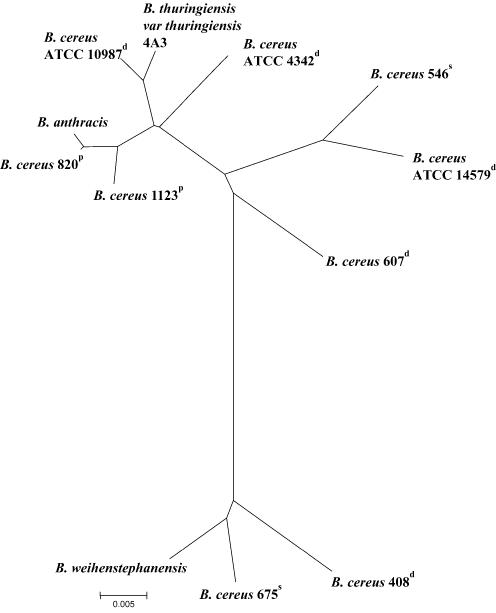
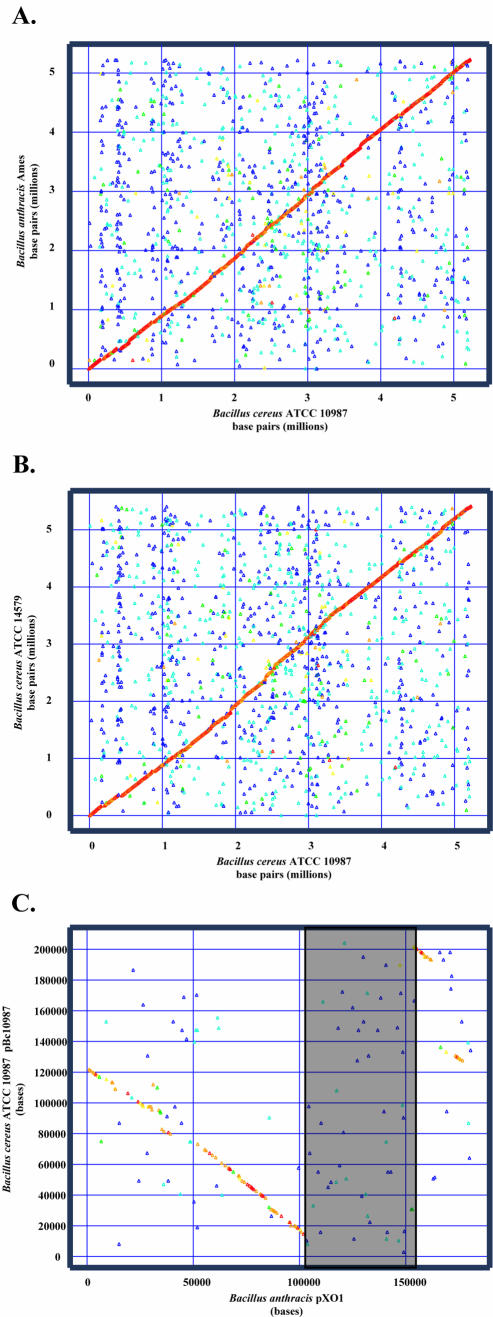
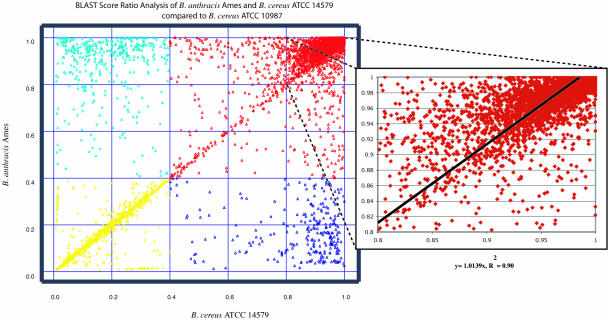
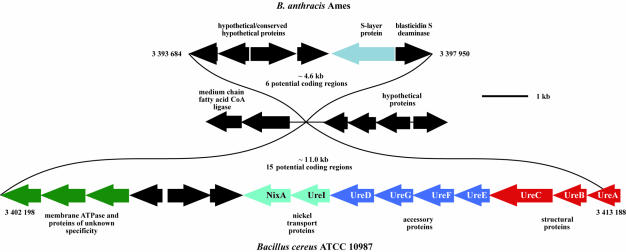
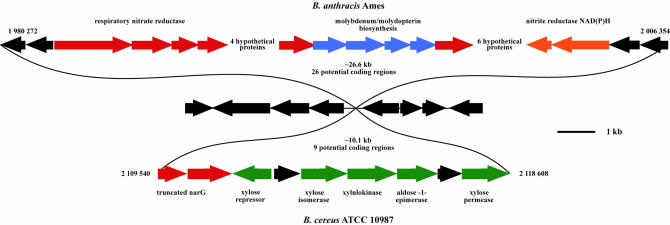
We sequenced the complete genome of Bacillus cereus ATCC 10987, a non-lethal dairy isolate in the same genetic subgroup as Bacillus anthracis. Comparison of the chromosomes demonstrated that B.cereus ATCC 10987 was more similar to B.anthracis Ames than B.cereus ATCC 14579, while containing a number of unique metabolic capabilities such as urease and xylose utilization and lacking the ability to utilize nitrate and nitrite. Additionally, genetic mechanisms for variation of capsule carbohydrate and flagella surface structures were identified. Bacillus cereus ATCC 10987 contains a single large plasmid (pBc10987), of approximately 208 kb, that is similar in gene content and organization to B.anthracis pXO1 but is lacking the pathogenicity-associated island containing the anthrax lethal and edema toxin complex genes. The chromosomal similarity of B.cereus ATCC 10987 to B.anthracis Ames, as well as the fact that it contains a large pXO1-like plasmid, may make it a possible model for studying B.anthracis plasmid biology and regulatory cross-talk.


Figures

Figure 1
Figure 1
Phylogenetic tree of members of the B.cereus sensu lato group. The tree was based on partial nucleotide sequences of seven housekeeping genes totaling 2977 nt (18) and was built using the neighbor-joining method (77) applied to a matrix of pairwise differences among sequences. The scale bar is an average number of nucleotide differences per site. Strains labeled with a ‘p’ were obtained from human patients, ‘s’ were isolated from soil, and ‘d’ indicates a dairy origin. All B.anthracis strains analyzed (n = 5) fall in the same location on the tree and thus no strain has been designated. Bacillus cereus clinical isolates were previously described (18,22).
Figure 2
Figure 2
Plot of BSRA based on genomic location. Each triangle indicates a single protein plotted on the 5′ end of the coding region in the reference genome and the best match in the query organism. They are color coded as follows: normalized score ≥0.95, red; normalized score ≥0.80 and <0.95, orange; normalized score ≥0.60 and <0.80, yellow; normalized score ≥0.40 and <0.60, green; normalized score ≥0.20 and <0.40, cyan; normalized score ≥0.0 and <0.20, blue. (A) Comparison of B.cereus ATCC 10987 (reference) and B.anthracis Ames (query). (B) Comparison of B.cereus ATCC 10987 (reference) and B.cereus ATCC 14579 (query). (C) Com parison of B.cereus ATCC 10987 pBc10987 (reference) and B.anthracis Ames pXO1 (query). The shaded region indicates the location of the pathogenicity-associated island in pXO1 that shows no similarity to the proteins of pBc10987.
Figure 3
Figure 3
BLAST score ratio analysis between the three genomes. Each point represents a single protein. Proteins that cluster in the upper right hand corner (red) are indicative of coding regions that are similar between all three organisms. Proteins in the lower right (blue) are those that are conserved among B.cereus ATCC 10987 and B.cereus ATCC 14579 but are not shared with B.anthracis; upper left (cyan) are similar between B.cereus ATCC 10987 and B anthracis; and lower left are unique to B.cereus ATCC 10987 (yellow). Proteins that are between these extreme regions are thought to be evolving. The inset evaluates the BLAST score ratio of the genes that are highly similar between the three B.cereus group genomes. The slope of the linear regression is 1.0139, which indicates that B.cereus ATCC 10987 proteins are generally more similar to B.anthracis Ames proteins than B.cereus ATCC 14579.
Figure 4
Figure 4
Venn diagram illustrating the number of putative proteins associated with each organism and the number shared with the intersecting organism. Tick marks that are on each circle represent the location of the unique proteins (BLAST score ratio less than 0.4) on the genome. (A) Chromosomal comparison: blue, B.anthracis Ames; green, B.cereus ATCC 10987; red, B.cereus ATCC 14579. (B) Plasmid comparison: blue, B.anthracis Ames pXO1; green, B.cereus ATCC 10987 pBc10987; magenta, B.thuringiensis subsp. israeliensis pBtoxis.
Figure 5
Figure 5
Bacillus cereus ATCC 10987 urease operon replacement. The gene cluster contains the three structural genes encoding the urease enzyme (ureCBA; BCE3664–BCE3662), genes for four accessory proteins responsible for insertion of Ni+ into the apo-enzyme (ureEFGD; BCE3661–BCE3658) and genes for two putative nickel transport proteins that are responsible for transporting Ni+ into the cell (nixA and ureI; BCE3656–BCE3657). The red genes are the structural urease genes, blue are urease accessory proteins, light blue are nickel transport proteins, black are hypothetical, and green are an unknown ABC transporter system. The urease cluster replaces the B.anthracis Ames/B.cereusATCC 14579 genes that encode hypothetical proteins, blasticidin S deaminase and an S layer protein.
Figure 6
Figure 6
Bacillus cereus ATCC 10987 xylose replacement. The xylose utilization operon (green) in B.cereus ATCC 10987 replaces the B.anthracis Ames/B.cereusATCC 14579 nitrate (red) reductase genes, molybdopterin synthesis genes (blue) and nitrite reductase (orange). Black are hypothetical and conserved hypothetical proteins.
Figure 7
Figure 7
Comparison of the putative B.cereus capsule biosynthesis region. The colored areas between the two regions indicate that these regions share a high level of identity (>10–5 BLAST, >60% amino acid identity). A conserved region consists of six contiguous genes, including a chain length-determining protein and polysaccharide capsule assembly proteins that are similar to putative polysaccharide capsule biosynthesis operons in B.subtilis (75), Oceanobacillus iheyensis (78) and Lactococcus lactis subsp. cremoris (79). However, the central portion of the polysaccharide capsule locus consists of novel genes that encode glycosyltransferases, a polysaccharide polymerase (BCE5389) and a putative translocase (BCE5386). Green arrows are carbohydrate utilization genes; blue, polysaccharide polymerase; dark red, chain length-determining protein; red, translocase (membrane protein); gray, conserved hypothetical; and black, hypothetical.

References

    1. Jensen G.B., Hansen,B.M., Eilenberg,J. and Mahillon,J. (2003) The hidden lifestyles of Bacillus cereus and relatives. Environ. Microbiol., 5, 631–640. - PubMed
    1. CDC (2001) Update: investigation of anthrax associated with intentional exposure and interim public health guidelines, October 2001. MMWR Morb. Mortal. Wkly Rep., 50, 889–893. - PubMed
    1. Aronson A.I. and Shai,Y. (2001) Why Bacillus thuringiensis insecticidal toxins are so effective: unique features of their mode of action. FEMS Microbiol. Lett., 195, 1–8. - PubMed
    1. Chan W.M., Liu,D.T., Chan,C.K., Chong,K.K. and Lam,D.S. (2003) Infective endophthalmitis caused by Bacillus cereus after cataract extraction surgery. Clin. Infect. Dis., 37, 31–34. - PubMed
    1. Callegan M.C., Kane,S.T., Cochran,D.C., Gilmore,M.S., Gominet,M. and Lereclus,D. (2003) Relationship of plcR-regulated factors to Bacillus endophthalmitis virulence. Infect. Immun., 71, 3116–3124. - PMC - PubMed

Publication types

MeSH terms

Substances