. 2004 Feb 11;32(3):1131-42.
doi: 10.1093/nar/gkh273. Print 2004.

Analysis and recognition of 5' UTR intron splice sites in human pre-mRNA

Affiliations

Analysis and recognition of 5' UTR intron splice sites in human pre-mRNA

E Eden et al. Nucleic Acids Res. .

Abstract

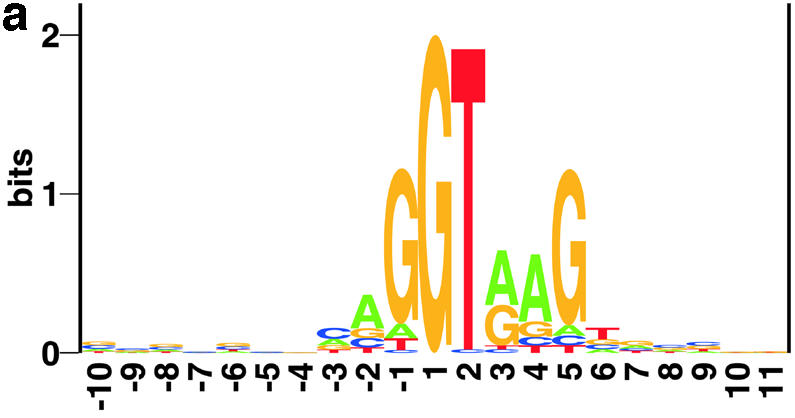
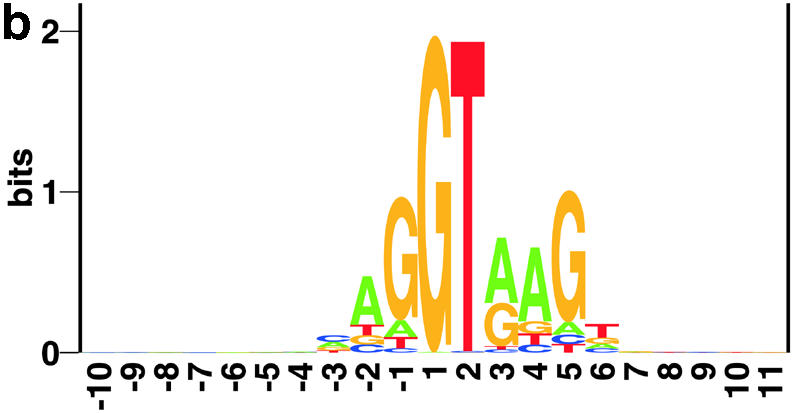
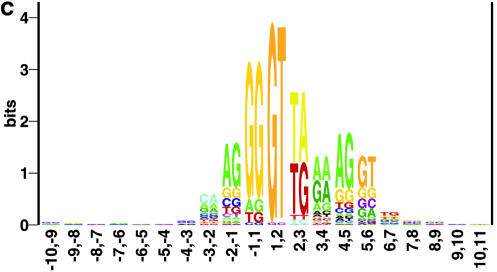
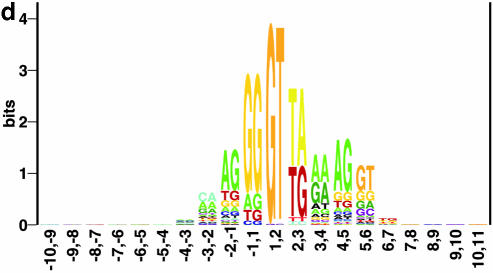
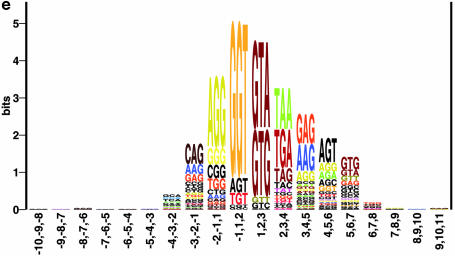
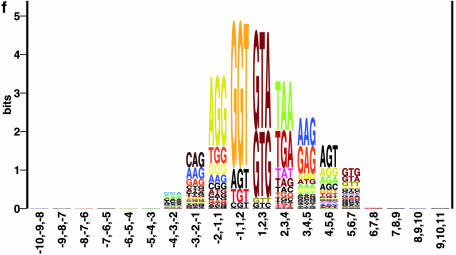
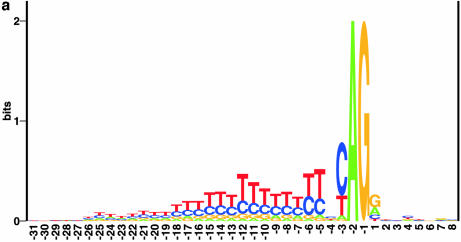
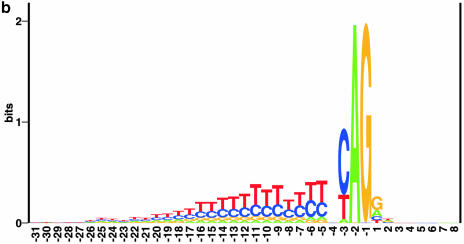
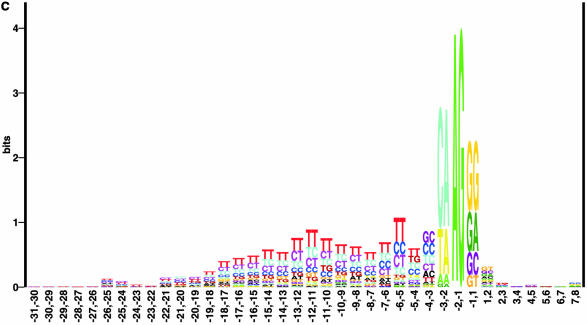
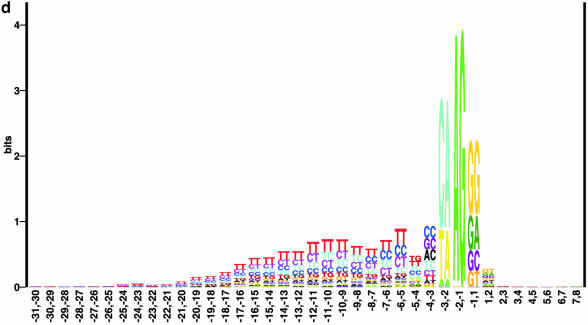
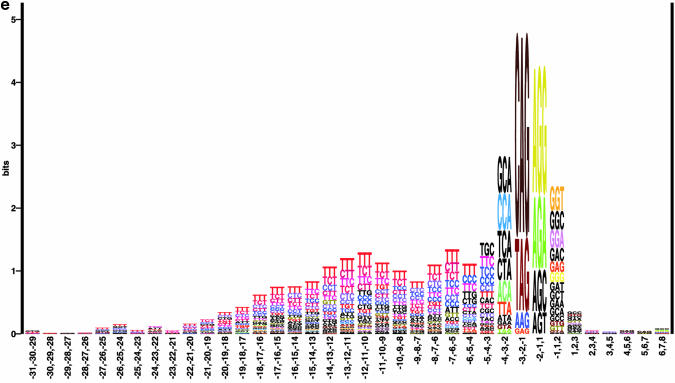
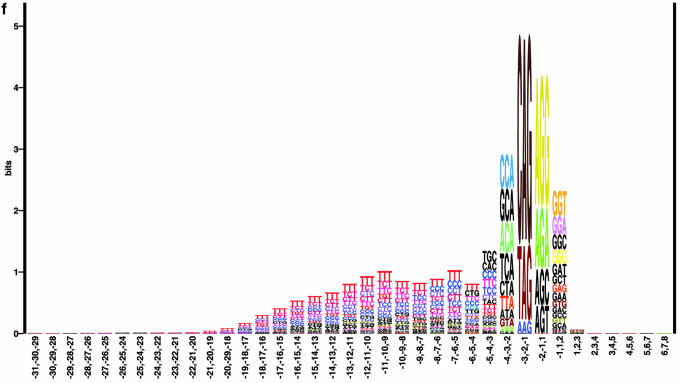
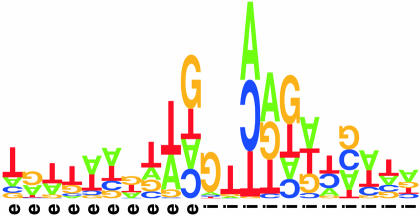
Prediction of splice sites in non-coding regions of genes is one of the most challenging aspects of gene structure recognition. We perform a rigorous analysis of such splice sites embedded in human 5' untranslated regions (UTRs), and investigate correlations between this class of splice sites and other features found in the adjacent exons and introns. By restricting the training of neural network algorithms to 'pure' UTRs (not extending partially into protein coding regions), we for the first time investigate the predictive power of the splicing signal proper, in contrast to conventional splice site prediction, which typically relies on the change in sequence at the transition from protein coding to non-coding. By doing so, the algorithms were able to pick up subtler splicing signals that were otherwise masked by 'coding' noise, thus enhancing significantly the prediction of 5' UTR splice sites. For example, the non-coding splice site predicting networks pick up compositional and positional bias in the 3' ends of non-coding exons and 5' non-coding intron ends, where cytosine and guanine are over-represented. This compositional bias at the true UTR donor sites is also visible in the synaptic weights of the neural networks trained to identify UTR donor sites. Conventional splice site prediction methods perform poorly in UTRs because the reading frame pattern is absent. The NetUTR method presented here performs 2-3-fold better compared with NetGene2 and GenScan in 5' UTRs. We also tested the 5' UTR trained method on protein coding regions, and discovered, surprisingly, that it works quite well (although it cannot compete with NetGene2). This indicates that the local splicing pattern in UTRs and coding regions is largely the same. The NetUTR method is made publicly available at www.cbs.dtu.dk/services/NetUTR.


Figures

Figure 1
Figure 1
Single nucleotide, dinucleotide and trinucleotide logo plots for donor splice sites that reside in the 5′ UTR (a, c and e) compared with the corresponding coding region donor sites (b, d and f). Only slight differences are found suggesting a dominance of the splice site signals at the nucleotide level over the amino acid coding constraints.
Figure 1
Figure 1
Single nucleotide, dinucleotide and trinucleotide logo plots for donor splice sites that reside in the 5′ UTR (a, c and e) compared with the corresponding coding region donor sites (b, d and f). Only slight differences are found suggesting a dominance of the splice site signals at the nucleotide level over the amino acid coding constraints.
Figure 2
Figure 2
Single nucleotide, dinucleotide and trinucleotide logo plots for acceptor splice sites that reside in the 5′ UTR (a, c and e) compared with the corresponding coding region acceptor sites (b, d and f). The 5′ UTR embedded acceptor splice sites have weaker bias for cytosine at position –3 and slightly stronger bias at positions –4 and 4 than that of coding region acceptor splice sites. The bias for thymine is stronger at several positions including –5, –6 and –12.
Figure 2
Figure 2
Single nucleotide, dinucleotide and trinucleotide logo plots for acceptor splice sites that reside in the 5′ UTR (a, c and e) compared with the corresponding coding region acceptor sites (b, d and f). The 5′ UTR embedded acceptor splice sites have weaker bias for cytosine at position –3 and slightly stronger bias at positions –4 and 4 than that of coding region acceptor splice sites. The bias for thymine is stronger at several positions including –5, –6 and –12.
Figure 3
Figure 3
The maximal correlation coefficient for the prediction of 5′ UTR donor sites in the test set as a function of the neural network window size.
Figure 4
Figure 4
Visualization of the relative size and sign of weights in a neural network trained to identify donor sites in 5′ UTRs. The network window has 21 positions, and the symbol sizes in the weight logo indicate the position-specific sizes and signs of the input-to-hidden weights weighted (multiplied) by the corresponding hidden-to-output weights. If negative, the symbols are shown upside-down. The weight logo shows the ‘contrast’ between true GT UTR donor sites and other UTR GTs. The numbering in the window has been replaced by e and i indicating where the corresponding signal is found in the actual sequence.
Figure 5
Figure 5
The maximal correlation coefficient for the prediction of 5′ UTR acceptor sites in the test set as a function of neural network window size.
Figure 6
Figure 6
A histogram of CpG scores for 5′ UTRs. The CpG score was calculated using a 201 nt long sliding window that starts 500 nt upstream of the 5′ UTR. The window slided 1 nt at a time and for each window the CpG percentage was calculated. The CpG window with the maximal percentage was defined as the CpG score of that 5′ UTR.

References

    1. Davuluri R.V., Suzuki,Y., Sugano,S. and Zhang,M.Q. (2000) CART classification of human 5′ UTR sequences. Genome Res., 10, 1807–1816. - PMC - PubMed
    1. Kozak M. (2001) Initiation of translation in prokaryotes and eukaryotes. Gene, 234, 187–208. - PubMed
    1. Meijer H.A. and Thomas,A.A.M. (2002) Control of eukaryotic protein synthesis by upstream open reading frames in the 5′-untranslated region of an mRNA. Biochem. J., 367, 1–11. - PMC - PubMed
    1. Pertea M., Lin,X. and Salzberg,S.L. (2001) GeneSplicer: a new computational method for splice site prediction. Nucleic Acids Res., 29, 1185–1190. - PMC - PubMed
    1. Brunak S., Engelbrecht,J. and Knudsen,S. (1991) Prediction of human mRNA donor and acceptor sites from the DNA sequence. J. Mol. Biol., 220, 49–65. - PubMed

Publication types

Associated data