. 2004 Mar 2;101(9):3196-201.
doi: 10.1073/pnas.0308600100. Epub 2004 Feb 12.

Neurons arise in the basal neuroepithelium of the early mammalian telencephalon: a major site of neurogenesis

Affiliations

Neurons arise in the basal neuroepithelium of the early mammalian telencephalon: a major site of neurogenesis

Wulf Haubensak et al. Proc Natl Acad Sci U S A. .

Abstract

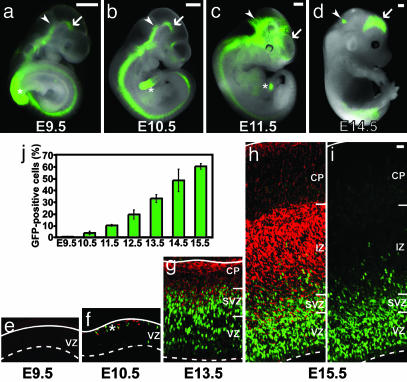
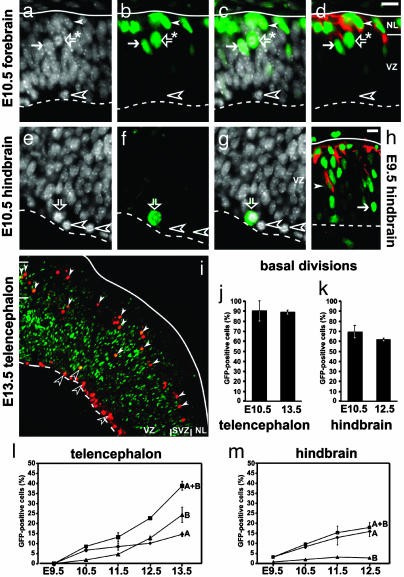
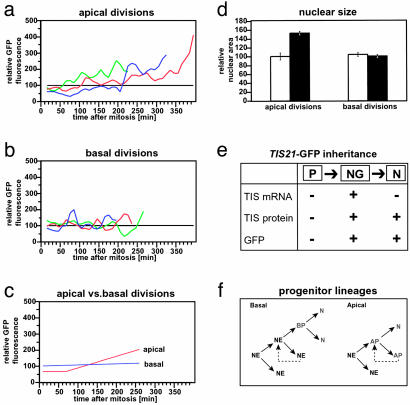
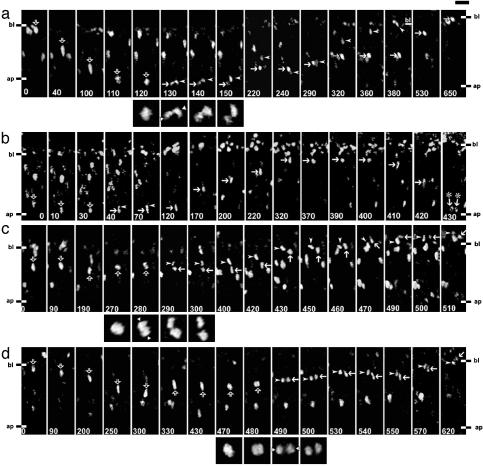
Neurons of the mammalian CNS are thought to originate from progenitors dividing at the apical surface of the neuroepithelium. Here we use mouse embryos expressing GFP from the Tis21 locus, a gene expressed throughout the neural tube in most, if not all, neuron-generating progenitors, to specifically reveal the cell divisions that produce CNS neurons. In addition to the apical, asymmetric divisions of neuroepithelial (NE) cells that generate another NE cell and a neuron, we find, from the onset of neurogenesis, a second population of progenitors that divide in the basal region of the neuroepithelium and generate two neurons. Basal progenitors are most frequent in the telencephalon, where they outnumber the apically dividing neuron-generating NE cells. Our observations reconcile previous data on the origin and lineage of CNS neurons and show that basal, rather than apical, progenitors are the major source of the neurons of the mammalian neocortex.


Figures

Fig. 1.
Fig. 1.
Heterozygous Tis21-GFP knock-in mouse embryos show GFP expression in the developing CNS in temporal and spatial correlation with neurogenesis. (a-d) GFP fluorescence in unfixed whole-mount preparations at various developmental stages. Arrows indicate the ventral midbrain (a and b) or the dorsal telencephalon (c and d); arrowheads the mid-hindbrain boundary (a-c) or the developing cerebellum (d). Note the spreading of GFP expression in the rostral and dorsal directions during development. Asterisks indicate the tailbud. (Scale bars, 500 μm.) (e-i) GFP fluorescence (green) and βIII-tubulin immunoreactivity (red) in cryosections of dorsal telencephalon at various developmental stages; i is the same cryosection as h except that the signal for βIII-tubulin immunoreactivity was omitted to facilitate the observation of GFP fluorescence in the neuronal layers. Solid white lines, basal lamina; dashed white lines, apical surface of neuroepithelium. IZ, intermediate zone, CP, cortical plate; NL, neuronal layers; asterisk in f, layer of the first neurons at the basal side of the VZ. (e-i are the same magnification; scale bar in the top right corner of i, 20 μm.) (j) Time course of the appearance of GFP-positive cells in the telencephalic VZ during embryonic neurogenesis, expressed as percentage of total VZ cells. Data are the mean of two embryos (>200 total cells counted per time point and embryo); bars indicate the variation of the individual values from the mean.
Fig. 2.
Fig. 2.
Not only a subpopulation of the mitotic cells at the apical side of the neuroepithelium, but also mitotic cells in the basal portion of the VZ and in the SVZ, show Tis21-driven GFP expression. (a-h) 4′,6-Diamidino-2-phenylindole staining (white; a, c, e, and g), GFP fluorescence (Green; b-d and f-h), and βIII-tubulin immunofluorescence (red; d and h) of the E10.5 telencephalon (a-d), E10.5 hindbrain (e-g), and E9.5 hindbrain at lower magnification (h). Solid white lines, basal lamina; dashed white lines, apical surface; arrows, GFP-expressing NE cells in interphase; open white arrowheads, mitotic NE cells lacking GFP. (a-g) Scale bar in top right corner of d, 20 μm. (a-d) Note the mitotic cell (open arrows with asterisk) in the basal portion of the VZ, which expresses GFP (b-d) but not βIII-tubulin (d), in contrast to the young neurons (solid white arrowheads; NL, neuron-containing layer), which contain both GFP (b-d) and βIII-tubulin (d). (e-g) At the apical surface of the VZ, mitotic NE cells lacking GFP are observed (open white arrowheads), which may coexist with mitotic NE cells expressing GFP (open arrows). (h) A newborn neuron (solid white arrowhead) in the VZ. (i) Low-power overview of the E13.5 telencephalon showing mitotic cells, identified by phosphohistone H3 immunostaining (red), at the apical surface (dashed white line) of the VZ and in the SVZ but not in the overlying neuron-containing layer (NL; solid white line, basal lamina). Mitotic cells in the VZ and SVZ showing GFP fluorescence (green) upon individual inspection at higher magnification (not shown) are indicated by open and filled white arrowheads, respectively; note that in the merged image shown, the phosphohistone H3 immunostaining (red) largely obscures the signal for GFP fluorescence, except for mitotic cells with high GFP levels (yellow). (j and k) Quantitation of mitotic GFP-positive cells in the basal portion of the VZ (plus, when present, the SVZ) of the telencephalon at E10.5 and E13.5 (j) and hindbrain at E10.5 and E12.5 (k), expressed as percentage of total mitotic cells in the basal portion of the VZ (plus, when present, the SVZ) (4-140 cells counted per embryo). (l and m) Quantitation of mitotic GFP-positive cells at the apical side of the neuroepithelium (A, diamonds) and in the basal portion of the VZ (plus, when present, the SVZ) (B, triangles), each expressed as percentage of total mitotic cells at the apical side of the neuroepithelium (130-900 cells counted per embryo), as well as the sum of both (A+B, squares), in the telencephalon (l) and hindbrain (m) at various developmental stages. (j-m) Data are the mean of two embryos (except for E9.5, which is a single embryo); bars indicate the variation of the individual values from the mean and are sometimes included within the symbol.
Fig. 4.
Fig. 4.
Apical vs. basal neuronal progenitors and their lineages: analysis of Tis21-driven GFP expression and nuclear size of daughter cells. (a-c) Time course of GFP fluorescence. Total GFP fluorescence was determined in the daughter cells originating from divisions at the apical surface (a) and in the basal region (b) of the VZ. For each of the time points (10-min intervals), the total GFP fluorescence in the daughter cell with a lesser integral of total GFP fluorescence over time was set to 100 (black lines), and the total GFP fluorescence in the other daughter cell was expressed relative to this (colored curves). (a and b) The curves show the moving average of two consecutive time points each. The curves showing a consistent increase in relative GFP fluorescence (a) correspond, in each case, to the trailing daughter cell that remained in the VZ. (c) The relative GFP fluorescence data of the three curves shown in a were used to calculate the mean values for (i) the initial GFP fluorescence, (ii) the lag phase before the GFP fluorescence increase, and (iii) the GFP fluorescence increase over time by using linear regression analysis (red line). Similarly, the relative GFP fluorescence data of the three curves shown in b, which did not show a consistent increase, were used to calculate the mean value for the GFP fluorescence over time by using linear regression analysis (blue line). (d) Increase in the size of the nucleus. The area of the GFP-stained nucleus over time was determined in the daughter cells originating from divisions at the apical surface (left columns) and in the basal region of the VZ (right columns). In two of three cases of apical divisions, the area of the nucleus of one of the daughter cells increased, relative to that of the other daughter cell, during the length of the time-lapse observation (left open column, relative area initially after mitosis; left filled column, relative area at the end of the time-lapse). Note that, in each case, this increase in nuclear size occurred in the daughter cell that also showed an increase in relative GFP fluorescence, migrated more slowly in the basal direction, and remained in the VZ. No such size increase was observed for the daughter cells originating from basal divisions (right columns). Data are the mean of two (left) and three (right) observations; bars indicate the variation of the individual values from the mean and the SD, respectively. (e) Scheme summarizing the expression of the Tis21 gene in neuronal progenitors and the passive inheritance of the TIS21 protein (22) and GFP (this study) by newborn neurons. P, NE cells undergoing proliferative division; NG, neuronal progenitors undergoing neuron-generating division; N, newborn neuron; arrows indicate lineage relationship. (f) Putative lineages of basal versus apical Tis21-GFP-expressing neuronal progenitors (green). NE, NE cell; AP, apical progenitor; BP, basal progenitor; N, neuron. Dashed lines indicate multiple rounds of asymmetric division.
Fig. 3.
Fig. 3.
Time-lapse multiphoton laser scanning microscopy, using slice cultures of E12.5 telencephalon, of cells in the VZ showing Tis21-driven GFP expression. Shown are examples of cells dividing at the apical surface (a and b) or in the basal region (c and d), and their progeny (HR-rendering mode). (a-d) bl, basal boundary of VZ (note that, at later stages of the time-lapse, this boundary shifts upwards in the panels shown due to growth of the VZ); ap, apical surface, which runs horizontally across the bottom of each panel as indicated; open arrows, mother cell; arrowheads and arrows, daughter cells. The time of observation is indicated in min at the bottom of each panel. The square panels underneath a, c, and d show the mitoses at higher magnification and with enhanced fluorescent signal; the two white triangles at the margins indicate the initial position of the daughter cell nuclei (parallel, oblique, or perpendicular to ventricular surface). [Scale bar above top right panel in a, 20 μm (rectangular panels) and 10 μm (square panels).] (a) The elongated mother cell nucleus migrates toward the apical surface (0-110 min); the cell rounds up for mitosis (110-120 min); the initial position of the daughter cell nuclei is parallel to the ventricular surface (130 min), followed by their rotation (130-150 min); the daughter cell nuclei migrate separately in the basal direction (150-220 min); the leading nucleus then turns around (220 min), migrating apically toward (220-240 min), and then basally together with (240-290 min) the trailing one; and finally separates from the latter to migrate to and beyond the basal boundary of the VZ (290-530 min, note basal boundary at 380 min), followed by the trailing nucleus, which eventually reaches this boundary (290-650 min, note the shift in basal boundary from 380 min to 650 min). (b) The mother cell nucleus migrates toward the apical surface (0-10 min); the cell rounds up for mitosis (30 min) and apparently generates an apical and a basal daughter cell, which remain in close proximity to each other (40-70 min) and of which the apical one (arrows) was tracked; the apical daughter cell nucleus migrates to the basal side of the VZ (120-320 min), pauses there (320-400 min), and migrates rapidly back to the apical surface (400-430 min) followed by mitosis (430 min, arrows with asterisks). (c) The nucleus of the mother cell pauses in the basal half of the VZ, with subtle basal-apical-basal movement (0-270 min), the cell divides in the basal region of the VZ (270-300 min) with the initial position of the daughter cell nuclei being perpendicular to the ventricular surface (280 min), and both daughter cell nuclei migrate together basally into the adjacent neuronal layer (300-510 min). Note that the long axis of the ellipsoid daughter cell nuclei loses the strict radial orientation, which it shows while migrating in the VZ (arrowheads, 300-420 min; arrows, 300-450 min), upon entering the neuronal layer (arrowheads, 430-460 min; arrows, 470-490 min). (d) The nucleus of the mother cell migrates in the apical direction but does not divide (0-300 min), turns around and pauses (300-430 min), the cell divides in the basal region of the VZ (470-500 min) with an initial position of the daughter cell nuclei parallel to the ventricular surface (490 min), and the daughter cell nuclei migrate as a couple basally toward the neuronal layers (500-620 min), with one of them entering it before the end of the time-lapse (arrow, 620 min).

References

    1. Rakic, P. (1988) Science 241, 170-176. - PubMed
    1. McConnell, S. K. (1995) Neuron 15, 761-768. - PubMed
    1. Huttner, W. B. & Brand, M. (1997) Curr. Opin. Neurobiol. 7, 29-39. - PubMed
    1. Caviness, V. S., Takahashi, T. & Nowakowski, R. S. (2000) in Results and Problems in Cell Differentiation, Mouse Brain Development, eds. Goffinet, A. M. & Rakic, P. (Springer, Berlin), Vol. 30, pp. 107-143. - PubMed
    1. Cai, L., Hayes, N. L., Takahashi, T., Caviness, V. S., Jr., & Nowakowski, R. S. (2002) J. Neurosci. Res. 69, 731-744. - PubMed

Publication types

MeSH terms