

Profiling of Arabidopsis secondary metabolites by capillary liquid chromatography coupled to electrospray ionization quadrupole time-of-flight mass spectrometry
- PMID: 14966245
- PMCID: PMC523888
- DOI: 10.1104/pp.103.032714
Profiling of Arabidopsis secondary metabolites by capillary liquid chromatography coupled to electrospray ionization quadrupole time-of-flight mass spectrometry
Abstract
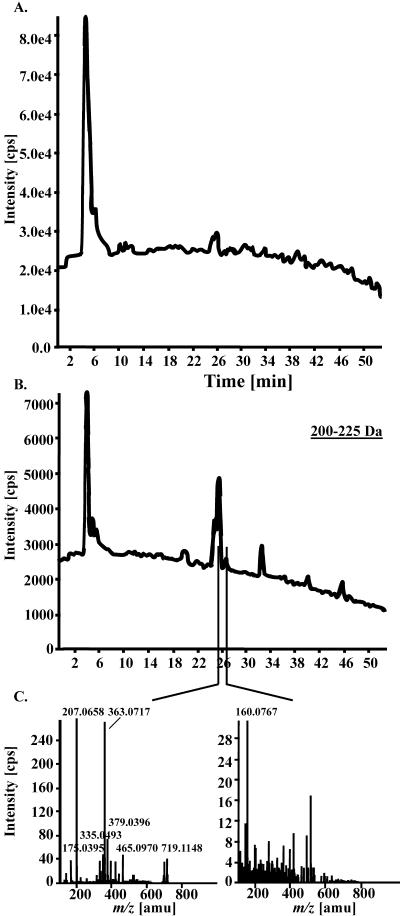
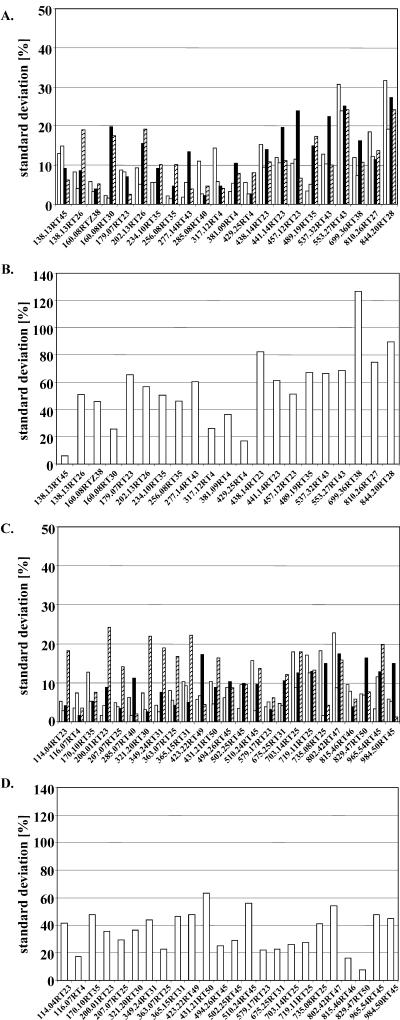
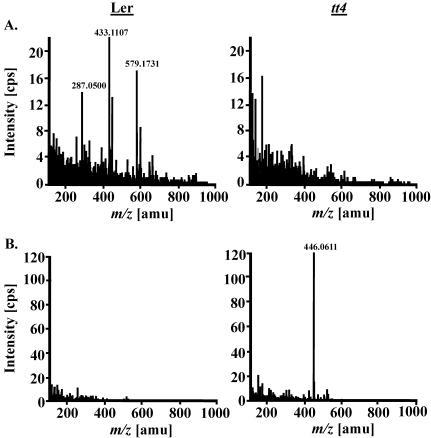
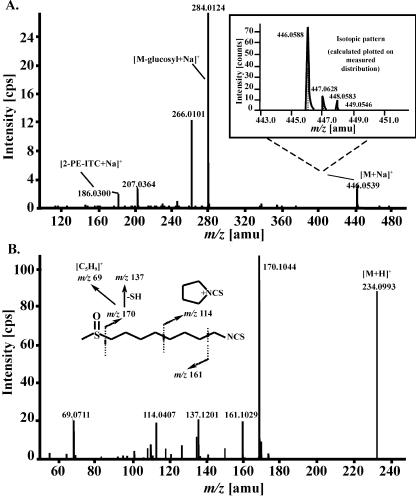
Large-scale metabolic profiling is expected to develop into an integral part of functional genomics and systems biology. The metabolome of a cell or an organism is chemically highly complex. Therefore, comprehensive biochemical phenotyping requires a multitude of analytical techniques. Here, we describe a profiling approach that combines separation by capillary liquid chromatography with the high resolution, high sensitivity, and high mass accuracy of quadrupole time-of-flight mass spectrometry. About 2000 different mass signals can be detected in extracts of Arabidopsis roots and leaves. Many of these originate from Arabidopsis secondary metabolites. Detection based on retention times and exact masses is robust and reproducible. The dynamic range is sufficient for the quantification of metabolites. Assessment of the reproducibility of the analysis showed that biological variability exceeds technical variability. Tools were optimized or established for the automatic data deconvolution and data processing. Subtle differences between samples can be detected as tested with the chalcone synthase deficient tt4 mutant. The accuracy of time-of-flight mass analysis allows to calculate elemental compositions and to tentatively identify metabolites. In-source fragmentation and tandem mass spectrometry can be used to gain structural information. This approach has the potential to significantly contribute to establishing the metabolome of Arabidopsis and other model systems. The principles of separation and mass analysis of this technique, together with its sensitivity and resolving power, greatly expand the range of metabolic profiling.
Figures
References
-
- Bjergegaard C, Buskov S, Sørensen H, Sørensen JC, Sørensen M, Sørensen S (2000) Reactions between glucosinolate products and thiol groups in food components. Czech J Food Sci 18: 193–195
-
- Chaney RL (1988) Plants can utilize iron from Fe-N, N′-di-(2-hydroxybenzoyl)-ethylenediamine-N, N′-diacetic acid, a ferric chelate with 106 greater formation constant than FE-EDDHA. J Plant Nutr 11: 1033–1050
-
- Chernushevich IV, Loboda AV, Thomson BA (2001) An introduction to quadrupole-time-of-flight mass spectrometry. J Mass Spectrom 36: 849–865 - PubMed
-
- De Hoffmann E (1996) Tandem mass spectrometry: a primer. J Mass Spectrom 31: 129–137
Publication types
MeSH terms
LinkOut - more resources
Full Text Sources
Other Literature Sources
