. 2004 Mar;24(5):1968-82.
doi: 10.1128/MCB.24.5.1968-1982.2004.

DNA methylation may restrict but does not determine differential gene expression at the Sgy/Tead2 locus during mouse development

Affiliations

DNA methylation may restrict but does not determine differential gene expression at the Sgy/Tead2 locus during mouse development

Kotaro J Kaneko et al. Mol Cell Biol. 2004 Mar.

Abstract

Soggy (Sgy) and Tead2, two closely linked genes with CpG islands, were coordinately expressed in mouse preimplantation embryos and embryonic stem (ES) cells but were differentially expressed in differentiated cells. Analysis of established cell lines revealed that Sgy gene expression could be fully repressed by methylation of the Sgy promoter and that DNA methylation acted synergistically with chromatin deacetylation. Differential gene expression correlated with differential DNA methylation, resulting in sharp transitions from methylated to unmethylated DNA at the open promoter in both normal cells and tissues, as well as in established cell lines. However, neither promoter was methylated in normal cells and tissues even when its transcripts were undetectable. Moreover, the Sgy promoter remained unmethylated as Sgy expression was repressed during ES cell differentiation. Therefore, DNA methylation was not the primary determinant of Sgy/Tead2 expression. Nevertheless, Sgy expression was consistently restricted to basal levels whenever downstream regulatory sequences were methylated, suggesting that DNA methylation restricts but does not regulate differential gene expression during mouse development.


Figures
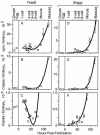
FIG. 1.
FIG. 1.
Tead2 and Sgy expression in mouse oocytes and preimplantation embryos. One-cell embryos were isolated from pregnant females and cultured in vitro to allow development up to the blastocyst stage (□). Some one-cell embryos were cultured in the presence of α-amanitin to prevent transcription (•). Some two-cell embryos were isolated from pregnant females (▪). RT-PCR was used to amplify the entire population of poly(A)+ mRNA from mouse ova and embryos under conditions that preserve the relative abundance of each mRNA in the cDNA population (31). Three to eight samples were used per stage. Data were fitted to a fourth-order polynomial with the standard error of the mean indicated. A 32P-labeled probe specific for Tead2 (A) or Sgy (D) was hybridized with this cDNA population, and the number of counts per minute per ovum or embryo was recorded. The data in panels A and D were used to calculate the number of copies of mTead2 (B) or Sgy (E) mRNA as previously described (31). The scale used in panels B and E was expanded to facilitate comparison of the early stages in development (C and F). The data for Tead2 were reproduced from reference ; in the process, an arithmetical error discovered in the Tead2 copy number was corrected.
FIG. 2.
FIG. 2.
Sgy and Tead2 expression in mouse ES cells and embryoid bodies. ES cells were cultured for the indicated number of days in the absence of leukemia inhibitory factor (LIF) after being transferred to petri dishes in order to induce cell differentiation. Quantitative poly(A)+ PCR assays for the indicated mRNA were carried out by repeatedly stripping and reprobing the same blot. Both short and long exposures of the same blots are provided to facilitate comparisons.
FIG. 3.
FIG. 3.
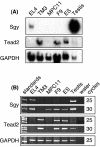
Sgy and Tead2 expression in mouse cells and tissues. (A) Total RNA (20 μg) was analyzed by Northern blotting-hybridization analysis (17). (B) Total RNA was isolated from the indicated cell or tissue (39) and assayed for Sgy, Tead2, or GAPDH mRNA by RT-PCR. Identity was based both on sequence specificity of primers and on amplicon size. Water was used for a mock RT-PCR. Numbers of PCR cycles are indicated on the right.
FIG. 4.
FIG. 4.
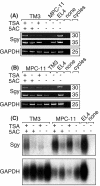
Sgy and Tead2 expression in mouse cells and tissues before and after treatment with 5AC. Splenocytes (Sc) are a lymphocyte population isolated from spleen tissue. Where indicated, cells were cultured in 1 μM 5AC for 48 h before RNA isolation. Total RNA was analyzed for Tead2, Sgy, and GAPDH expression by RT-PCR.
FIG. 5.
FIG. 5.
Effects of 5AC and TSA on Sgy expression in mouse TM3 (A) and MPC-11 (B) cells. Where indicated, cells were cultured in 1 μM 5AC for 48 h, in 1 μM TSA (Wako) for 24 h, or in 1 μM 5AC for 24 h and then in 1 μM 5AC and TSA for 24 h. Total RNA was isolated and used to determine gene expression levels by RT-PCR (A and B) or poly(A)+ PCR (C) assays.
FIG. 6.
FIG. 6.
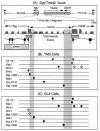
Methylation status of 11 CpG dinucleotides within the Sgy/Tead2 gene locus. The methylation status of a 7.9-kb SacI DNA fragment containing the Sgy and Tead2 gene start sites was characterized. (A) Schematic representation of the 23.0-cM region within chromosome 7 containing the Sgy, Tead2, and CD37 genes (GenBank accession number NW000319), with a more detailed representation of an ∼7.9-kb SacI fragment containing the Tead2/Sgy intergenic region (GenBank accession number AF274313). The Sgy gene consists of 5 exons within a 4.6-kb region, and the Tead2 gene consists of 12 exons within a 17.9-kb region (43). Indicated are the number of CpG dinucleotides (lollipops) per 0.5-kb segment (not arranged according to map position), the locations of the only two CpG islands (nucleotides 1868 to 2370 and 5941 to 6620) in the bp 1 to 7866 region, the start sites for the Sgy (nucleotide 2166) and Tead2 (nucleotide 6031) mRNAs, and the sequence used as a probe to detect specific restriction endonuclease cleavage events. (B) Methylation status of 11 CpG dinucleotides in TM3 cells, which express Tead2 but not Sgy (•, mCpG; ○, CpG). (C) Methylation status of 11 CpG dinucleotides in EL4 cells, which express Sgy but not Tead2. The transitions from unmethylated to methylated DNA (vertical shaded bars) determined from these analyses were 385 bp at the Sgy locus and 789 bp at the Tead2 locus.
FIG. 7.
FIG. 7.
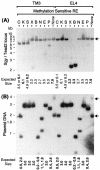
Digestion of genomic DNA with methylation-sensitive restriction endonucleases (RE). (A) DNA from either TM3 or EL4 cells was digested with SacI and then with the indicated methylation-sensitive restriction endonuclease (see Fig. 6B and C). DNA digestion products were fractionated by gel electrophoresis and visualized with a 32P-labeled DNA probe (Fig. 6A) by blotting-hybridization. (B) The extent of DNA cleavage in each genomic DNA sample was monitored by cleavage of an unmethylated plasmid DNA added as an internal standard. Arrows indicate the positions of undigested SacI DNA fragments. The size(s) of the expected DNA product(s) from each digestion is indicated at the bottom of each lane, while boldface values indicate the sizes of the DNA fragments observed. The endonucleases used were Cfr10I (C), KspI (K), SmaI (S), XhoI (X), Bsh1285I (B), NsbI (N), Eco47III (E), and Psp1406 (P).
FIG. 8.
FIG. 8.
Detection of DNase I-hypersensitive sites. (A) Nuclei were isolated from EL4, MPC11, F9, or TM3 cells and digested with increasing amounts of DNase I. No DNase I was added to lane 0. Genomic DNA was purified, digested with SacI, fractionated by gel electrophoresis, and visualized with a 32P-labeled DNA probe (Fig. 6A) by blotting-hybridization. The positions of an ∼7.8-kb SacI fragment and fragments generated because of the presence of hypersensitive sites are indicated by arrows. DNase I-hypersensitive sites (S1, S2, and S3) in the Sgy gene were located at approximately map positions −430, −120, and +615, respectively. Hypersensitive site T1 in the Tead2 gene was located at approximately position −140. (B) Map positions of the Sgy and Tead2 mRNA start sites, DNase I-hypersensitive sites, and methylated regions in TM3 and EL4 cells (see Fig. 6A).
FIG. 9.
FIG. 9.
Transition between unmethylated and methylated DNA upstream of the Sgy gene mRNA start site. Bisulfite genomic sequencing analysis was applied to a single 449-bp DNA fragment from position −679 to position −230 in EL4 cells. (A) Twelve random clones were isolated from a PCR amplicon and sequenced. Their methylation status is shown. (B) About 10% of the total PCR amplicon was sequenced directly to obtain the methylation status of the entire population. Seven of the 12 CpGs in this sequence are shown as an example. Nucleotides appear as color-coded peaks in the electropherogram. CpG dinucleotides are enclosed by rectangles, and their methylation status is indicated by an open (CpG) or closed (mCpG) lollipop.
FIG. 10.
FIG. 10.
Methylation status of 52 CpG dinucleotides at the Sgy gene locus in mouse cells and tissues. Bisulfite genomic sequencing analysis was applied to three DNA fragment amplicons (A, B, and C [Table 2]) that encompass nucleotides +699 to −655 in the indicated cells and tissues (open circles = CpG; filled circles = mCpG; half-filled circles = mixed population). The CpG-to-mCpG transition mapped in Fig. 9 is indicated. (A) Four established cell lines. (B) CA51 cells before (CA51) and after (CA51*) treatment with 5AC as described in the legend to Fig. 4. (C) Germ cells, preimplantation embryos, ES cells, and ES cells undergoing differentiation (embryoid bodies [EB] at days 2 and 7). (D) Splenocytes and tissues. Nucleotide positions of the first and last CpG in each box, the number of base pairs encompassed by each box, and the positions of DNase I-hypersensitive (HS) sites (Fig. 8) are indicated.
FIG. 11.
FIG. 11.
Methylation status of 36 CpG dinucleotides at the Tead2 gene locus in mouse cells and tissues. Bisulfite genomic sequencing analysis was applied to the Tead2 locus. The status of some CpGs (divided circles) was not determined, because primers were not found that would amplify bisulfite-treated DNA in this region. The methylation status of CpG's from −601 to −1171 (amplicon F [Table 2]) was determined for TM3 and EL4 cells. The shaded vertical bar indicates the CpG-to-mCpG transition defined in Fig. 6. (A) Five established cell lines. (B) Same as Fig. 10C. (C) Same as Fig. 10D.

Similar articles

Cited by

References

    1. Adachi, N., and M. R. Lieber. 2002. Bidirectional gene organization: a common architectural feature of the human genome. Cell 109:807-809. - PubMed
    1. Baylin, S. B., M. Esteller, M. R. Rountree, K. E. Bachman, K. Schuebel, and J. G. Herman. 2001. Aberrant patterns of DNA methylation, chromatin formation and gene expression in cancer. Hum. Mol. Genet. 10:687-692. - PubMed
    1. Brady, G., and N. N. Iscove. 1993. Construction of cDNA libraries from single cells. Methods Enzymol. 225:611-623. - PubMed
    1. Cameron, E. E., K. E. Bachman, S. Myohanen, J. G. Herman, and S. B. Baylin. 1999. Synergy of demethylation and histone deacetylase inhibition in the re-expression of genes silenced in cancer. Nat. Genet. 21:103-107. - PubMed
    1. Clark, S. J., J. Harrison, C. L. Paul, and M. Frommer. 1994. High sensitivity mapping of methylated cytosines. Nucleic Acids Res. 22:2990-2997. - PMC - PubMed

Publication types

MeSH terms