. 2004 May 1;556(Pt 3):711-26.
doi: 10.1113/jphysiol.2003.059675. Epub 2004 Feb 13.

Capacitance measurements of exocytosis in mouse pancreatic alpha-, beta- and delta-cells within intact islets of Langerhans

Affiliations

Capacitance measurements of exocytosis in mouse pancreatic alpha-, beta- and delta-cells within intact islets of Langerhans

Sven Göpel et al. J Physiol. .

Abstract

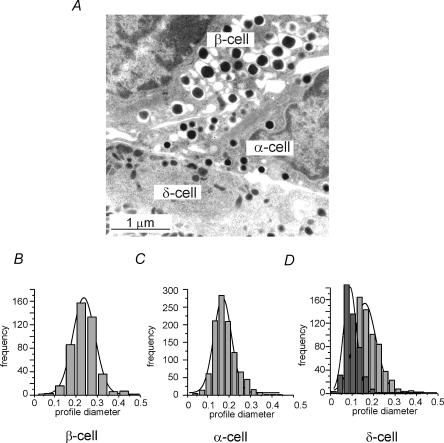
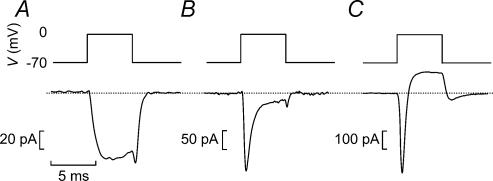
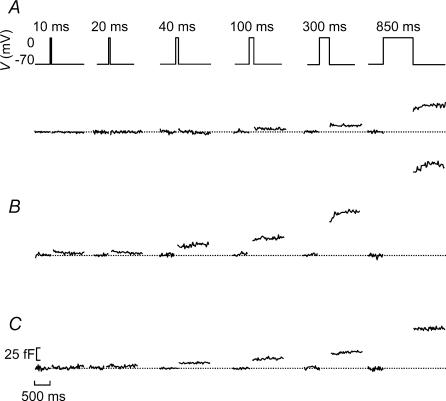
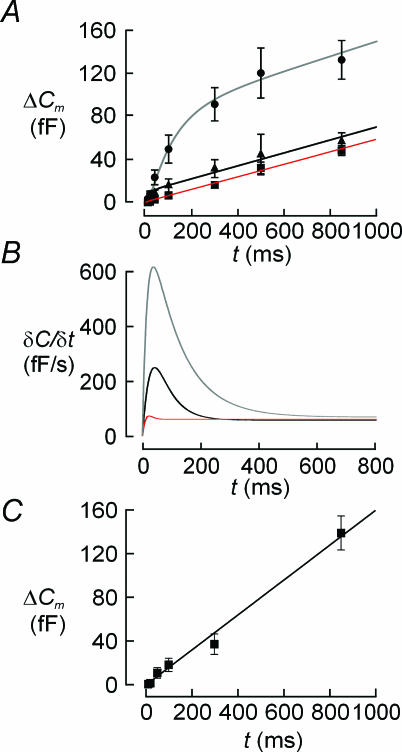
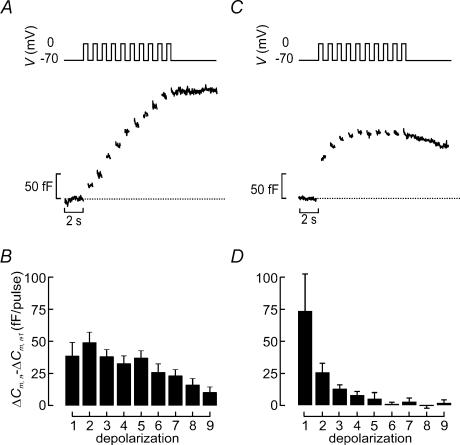
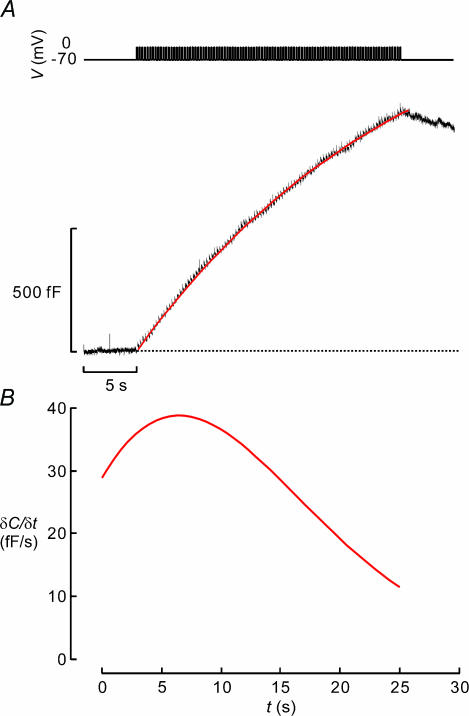
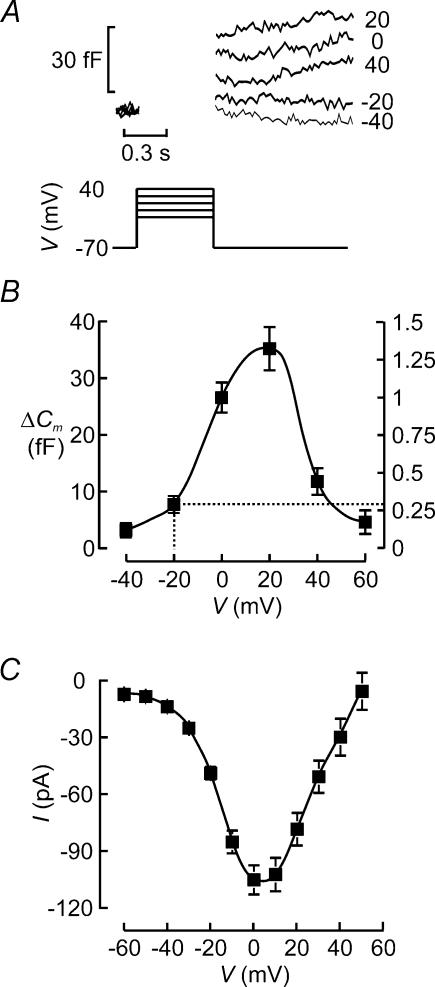
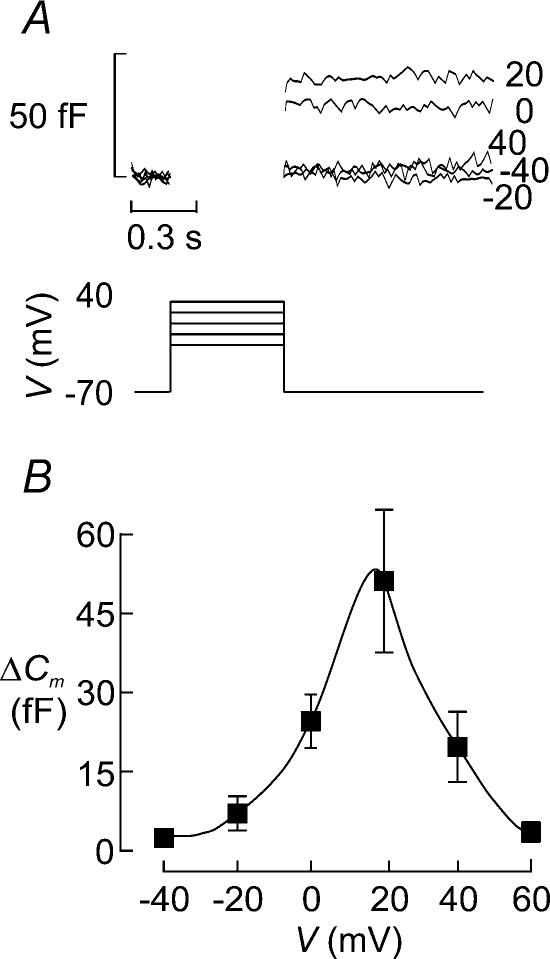
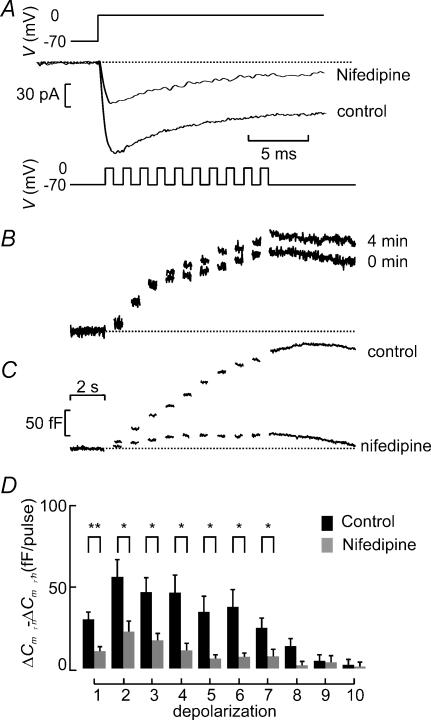
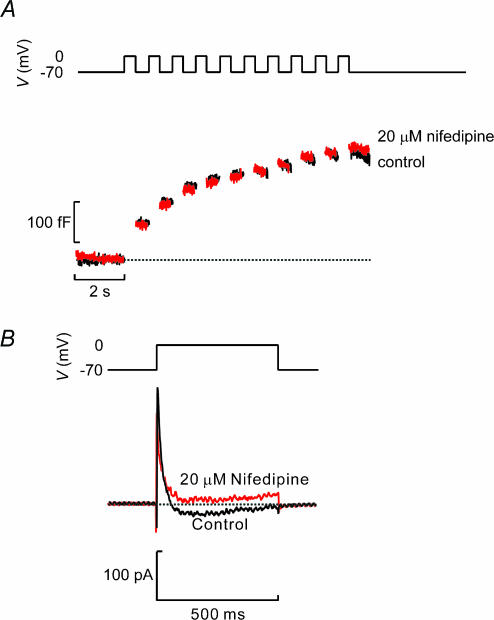
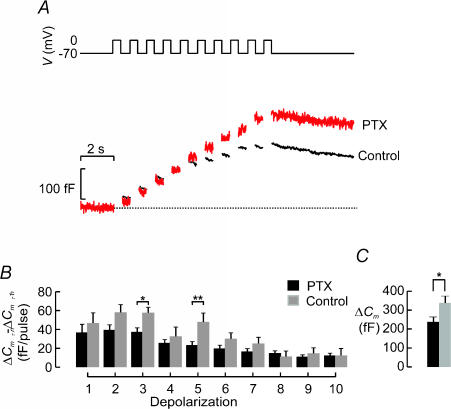
Capacitance measurements of exocytosis were applied to functionally identified alpha-, beta- and delta-cells in intact mouse pancreatic islets. The maximum rate of capacitance increase in beta-cells during a depolarization to 0 mV was equivalent to 14 granules s(-1), <5% of that observed in isolated beta-cells. Beta-cell secretion exhibited bell-shaped voltage dependence and peaked at +20 mV. At physiological membrane potentials (up to approximately -20 mV) the maximum rate of release was approximately 4 granules s(-1). Both exocytosis (measured by capacitance measurements) and insulin release (detected by radioimmunoassay) were strongly inhibited by the L-type Ca(2+) channel blocker nifedipine (25 microm) but only marginally (<20%) affected by the R-type Ca(2+) channel blocker SNX482 (100 nm). Exocytosis in the glucagon-producing alpha-cells peaked at +20 mV. The capacitance increases elicited by pulses to 0 mV exhibited biphasic kinetics and consisted of an initial transient (150 granules s(-1)) and a sustained late component (30 granules s(-1)). Whereas addition of the N-type Ca(2+) channel blocker omega-conotoxin GVIA (0.1 microm) inhibited glucagon secretion measured in the presence of 1 mm glucose to the same extent as an elevation of glucose to 20 mm, the L-type Ca(2+) channel blocker nifedipine (25 microm) had no effect. Thus, glucagon release during hyperglycaemic conditions depends principally on Ca(2+)-influx through N-type rather than L-type Ca(2+) channels. Exocytosis in the somatostatin-secreting delta-cells likewise exhibited two kinetically separable phases of capacitance increase and consisted of an early rapid (600 granules s(-1)) component followed by a sustained slower (60 granules s(-1)) component. We conclude that (1) capacitance measurements in intact pancreatic islets are feasible; (2) exocytosis measured in beta-cells in situ is significantly slower than that of isolated cells; and (3) the different types of islet cells exhibit distinct exocytotic features.


Figures

Figure 1
Figure 1. Ultrastructure of α-, β- and δ-cell granules
A, electron micrograph of mouse α-, β- and δ-cell as indicated. B–D, histograms of the profile diameter of granules from β-cells (B) and α-cells (C) as well as the profiles of the long (a; light grey) and short (b; dark grey) axes of δ-cell granules D, the continuous curves represent Gaussian fits to the respective distribution needed to estimate the actual diameters (α- and β-cells) and long and short axes (δ-cells), respectively. Scale bars correspond to 1 μm.
Figure 2
Figure 2. Functional identification of mouse pancreatic α-, β- and δ-cells in intact mouse pancreatic islets
A–C, membrane currents elicited by a 5-ms depolarization from −70 mV to 0 mV using a K+-containing intracellular solution and the standard extracellular solution supplemented with 20 mm TEA in a β-cell (A, only Ca2+ current), in a δ-cell (B, transient Na+ current and sustained Ca2+ current) and in an α-cell (C, transient inward current followed by TEA-resistant outward K+ current). The dotted line indicates the zero current level.
Figure 3
Figure 3. Time course of exocytosis measured in intact pancreatic islets in functionally identified α-, β- and δ-cells
A–C, capacitance increases elicited by progressively longer (duration indicated above schematic voltage trace) depolarizing commands from −70 mV to 0 mV in a β-cell (A), in a δ-cell (B) and in an α-cell (C). Cells were identified as outlined in Fig. 2 and traces are representative of 140 (A), 48 (B) and 15 (C) cells. The horizontal dotted lines show the prestimulatory capacitance level before each stimulus. The horizontal and vertical scale bars shown in C also apply to A and B.
Figure 4
Figure 4. Distinct release kinetics of α-, β-and δ-cells in intact islets
A, relationships between pulse duration (t) and depolarization-evoked capacitance increases (ΔC) in pancreatic δ-cells (•), α-cells (▴) and β-cells (▪). Data are mean values ±s.e.m. recorded from 48 δ-cells, 15 α-cells and 140 β-cells. The curve superimposed on data points was derived by approximating eqn (3) in Barg et al. (2001) to the observed values. B, time course of exocytosis in δ-cells (top curve), α-cells (middle curve) and β-cells (lower curve) obtained by calculating the time derivative (δCt) of the continuous curves superimposed on data points in panel A. C, time course of exocytosis in the 14% of β-cells showing the largest exocytotic responses (n = 20).
Figure 5
Figure 5. Distinct patterns of exocytosis during repetitive stimulation in α- and β-cells
A, capacitance increases (bottom) elicited by a train of depolarizations from −70 mV to 0 mV (top) in a β-cell identified as described in Fig. 2.B, increase in cell capacitance per pulse (ΔCm,n−ΔCm,n−1) displayed against depolarization number (n). C and D, as in A and B but functionally identified α-cells were used. Data are presented as mean values ±s.e.m. of 31 β-cells (B) and 4 α-cells (D).
Figure 6
Figure 6. Exocytosis in β-cell elicited by action potential-like stimulation
A, a β-cell was stimulated by a train of 50-ms depolarizations from −70 mV to 0 mV applied at a frequency of 4 Hz (top). Exocytosis was measured as a capacitance increases (ΔC, bottom). Data represent the average of 16 separate experiments. The continuous superimposed curve was derived by low-pass filtering the capacitance signal at 100 Hz and using the function of sigmoidal Weibull function (type-2). B, time derivative (δCt) of the continuous curve in A.
Figure 7
Figure 7. Voltage dependence of exocytosis in β-cell
A, capacitance increases (bottom) elicited by 500-ms depolarizations (top) from −70 mV to −40, −20, 0, +20 and +40 mV. The voltages during the depolarizations are indicated to the right of the respective capacitance traces. B, capacitance increase (ΔC) displayed against the voltage during the depolarizing pulses (V). Data are mean values ±s.e.m. of 32 experiments. The right hand axis indicates the exocytosis normalized to the response observed at 0 mV. The dotted lines indicate amplitude of exocytosis measured at −20 mV, which corresponds to the peak of the action potential (see Discussion). C, peak Ca2+ current amplitude (I) displayed against voltage during depolarization (V). Note that the current amplitude is maximal between 0 and +10 mV and that the current reverses at (+60 mV. Data are mean values ±s.e.m. of 20 experiments.
Figure 8
Figure 8. Membrane potential dependence of exocytosis in α-cells
A, capacitance increases (bottom) elicited by 500-ms depolarizations (top) from −70 mV to −40, −20, 0, +20 and +40 mV. The voltages during the depolarizations are indicated to the right of the respective capacitance traces. B, capacitance increase (ΔC) displayed against the voltage during the depolarizing pulses (V). Data are mean values ±s.e.m. of 10 experiments.
Figure 9
Figure 9. Suppression of β-cell exocytosis when Ca2+-entry following inhibition of L-type Ca2+ channels
A, whole-cell Ca2+ currents (bottom) elicited by voltage-clamp depolarizations from −70 mV to 0 mV (top) in functionally identified β-cell under control conditions and after application of 25 μm nifedipine. B, capacitance increases (bottom) elicited by trains of 10 500-ms depolarizations (top) applied to the same β-cell in an intact islets shortly after establishment of the whole-cell configuration (0 min) and 4 min later. C, same as in B but records were obtained from a β-cell under control conditions (shortly after establishment of whole-cell mode) and 2 min after addition of 20 μm nifedipine. D, increase in cell capacitance per pulse (ΔCm,n−ΔCm,n−1) displayed against depolarization number under control conditions and in the presence of nifedipine. Data were obtained during second train applied to the cell both in the presence and absence of the antagonist and represent mean values ±s.e.m. of 8 (control) and 6 (nifedipine) experiments. *P < 0.05; **P < 0.01. Scale bars in C also apply to B.
Figure 10
Figure 10. Glucagon secretion does not depend on Ca2+ influx through L-type Ca2+ channels
A, capacitance increases (bottom) elicited by trains of 10 500-ms depolarizations (top) applied to β-cells in intact islets before and 2 min after addition of 25 μm nifedipine. B, voltage-gated membrane currents elicited by depolarization from −70 mV to 0 mV before and after inclusion of 25 μm nifedipine. Note that nifedipine blocked a sustained inward current whereas transient inward Na+ and outward A currents were unaffected.
Figure 11
Figure 11. Tonic inhibition of exocytosis in β-cells in intact islets
A, exocytosis (ΔCm) measured in response to a train consisting of 10 500-ms depolarizations (1 Hz) in functionally identified β-cells pretreated (PTX) or not (Control) for 12 h with 100 ng ml−1 pertussis toxin. B, increase in cell capacitance (ΔCm,n−ΔCm,n−1) per pulse displayed against depolarization number (n) under control conditions (black) and after pretreatment with pertussis toxin (grey). Data are mean values ±s.e.m. of 30 (control) and 12 (pertussis toxin) experiments. *P < 0.05.

References

    1. Ammala C, Ashcroft FM, Rorsman P. Calcium-independent potentiation of insulin release by cyclic AMP in single β-cells. Nature. 1993a;363:356–358. - PubMed
    1. Ammala C, Eliasson L, Bokvist K, Berggren PO, Honkanen RE, Sjoholm A, et al. Activation of protein kinases and inhibition of protein phosphatases play a central role in the regulation of exocytosis in mouse pancreatic β cells. Proc Natl Acad Sci U S A. 1994;91:4343–4347. - PMC - PubMed
    1. Ammala C, Eliasson L, Bokvist K, Larsson O, Ashcroft FM, Rorsman P. Exocytosis elicited by action potentials and voltage-clamp calcium currents in individual mouse pancreatic B-cells. J Physiol. 1993b;472:665–688. - PMC - PubMed
    1. Ashcroft FM, Rorsman P. Elecrophysiology of pancreatic islet cells. In: Scherübl HH, Hescheler J, editors. The Electrophysiology of Neuroendocrine Cells. Boca Raton, FL, USA: CRC Press; 1995. pp. 207–243.
    1. Atwater I, Ribalet B, Rojas E. Mouse pancreatic β-cells: tetraethylammonium blockage of the potassium permeability increase induced by depolarization. J Physiol. 1979;288:561–574. - PMC - PubMed

Publication types

MeSH terms

LinkOut - more resources