. 2004 May 1;556(Pt 3):805-17.
doi: 10.1113/jphysiol.2003.060004. Epub 2004 Feb 13.

Modulation of plasma membrane calcium-ATPase activity by local calcium microdomains near CRAC channels in human T cells

Affiliations

Modulation of plasma membrane calcium-ATPase activity by local calcium microdomains near CRAC channels in human T cells

Diana M Bautista et al. J Physiol. .

Abstract

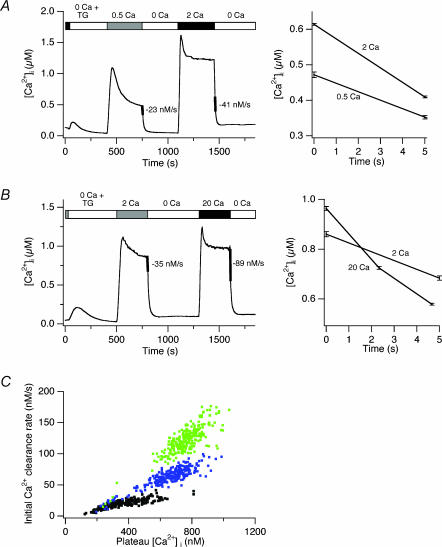
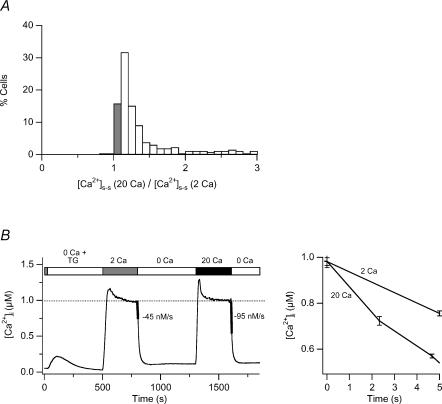
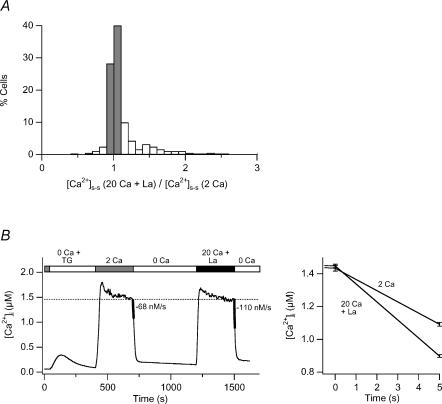
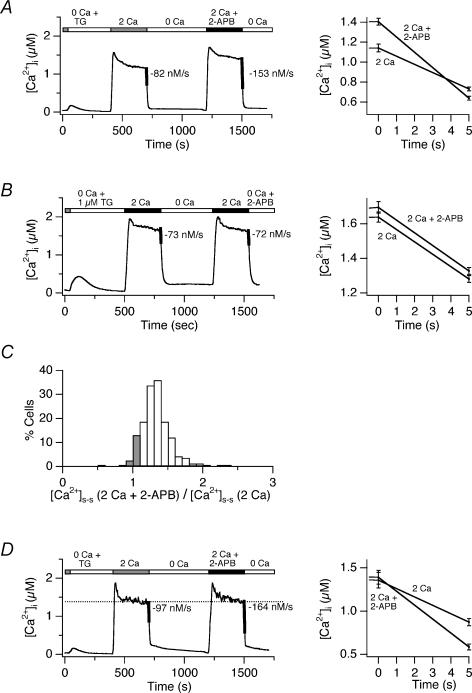
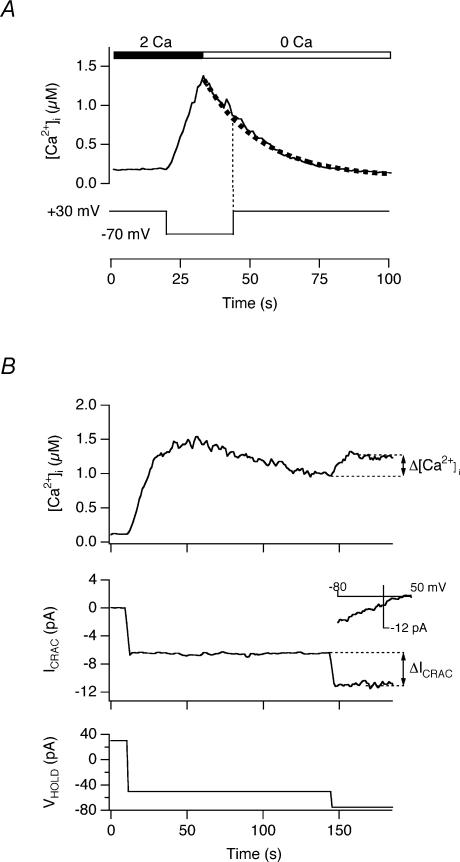
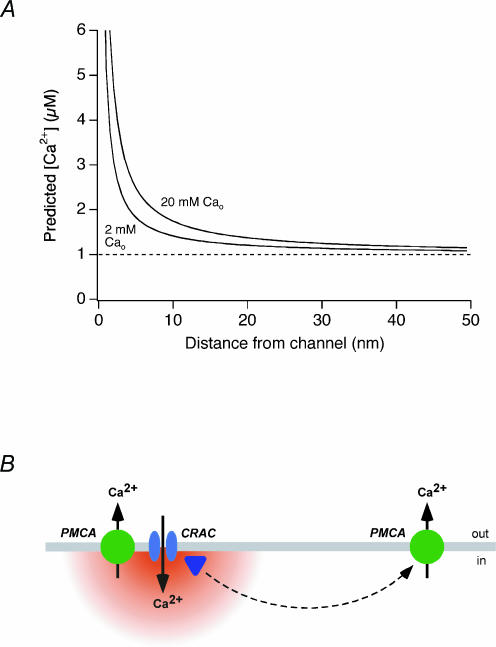
The spatial distribution of Ca(2+) signalling molecules is critical for establishing specific interactions that control Ca(2+) signal generation and transduction. In many cells, close physical coupling of Ca(2+) channels and their targets enables precise and robust activation of effector molecules through local [Ca(2+)](i) elevation in microdomains. In T cells, the plasma membrane Ca(2+)-ATPase (PMCA) is a major target of Ca(2+) influx through Ca(2+) release-activated Ca(2+) (CRAC) channels. Elevation of [Ca(2+)](i) slowly modulates pump activity to ensure the stability and enhance the dynamic nature of Ca(2+) signals. In this study we probed the functional organization of PMCA and CRAC channels in T cells by manipulating Ca(2+) microdomains near CRAC channels and measuring the resultant modulation of PMCAs. The amplitude and spatial extent of microdomains was increased by elevating the rate of Ca(2+) entry, either by raising extracellular [Ca(2+)], by increasing the activity of CRAC channels with 2-aminoethoxyborane (2-APB), or by hyperpolarizing the plasma membrane. Surprisingly, doubling the rate of Ca(2+) influx does not further increase global [Ca(2+)](i) in a substantial fraction of cells, due to a compensatory increase in PMCA activity. The enhancement of PMCA activity without changes in global [Ca(2+)](i) suggests that local [Ca(2+)](i) microdomains near CRAC channels effectively promote PMCA modulation. These results reveal an intimate functional association between CRAC channels and Ca(2+) pumps in the plasma membrane which may play an important role in governing the time course and magnitude of Ca(2+) signals in T cells.


Figures

Figure 1
Figure 1. Effects of extracellular [Ca2+] on modulation of PMCA
TG (1 μm) was present in all solutions, beginning with 0 Ca2+ Ringer solution, as indicated, to deplete Ca2+ stores and activate CRAC channels. A, measurement of Ca2+ clearance rates following [Ca2+]i elevation induced by 0.5 or 2 mm Ca2+o. The clearance rate at a common [Ca2+]i following removal of Ca2+o was measured by the d[Ca2+]i/dt slopes over 5 s periods indicated by the thickened lines. The Ca2+ clearance data during these periods are overlaid on an expanded time scale to the right. Average response of 261 cells. Bars indicate s.e.m. in this and all subsequent figures. B, measurement of Ca2+ clearance rates following [Ca2+]i elevation induced by 2 or 20 mm Ca2+o. Slopes were measured by linear regression over a 5 s period immediately following removal of [Ca2+]o as indicated by the thickened lines. Data are overlaid and displayed on an expanded scale to the right. Average response of 261 cells. C, clearance rate in single cells as a function of [Ca2+]i following long exposures to different [Ca2+]o. Data from the experiments in A and B. Each symbol represents the initial rate of Ca2+ clearance after removal of Ca2+o plotted against the immediately preceding plateau [Ca2+]i produced by 0.5 mm (black), 2 mm (blue) or 20 mm (green) Ca2+o. Each cell is represented by a pair of points (0.5 and 2 mm, or 2 and 20 mm).
Figure 2
Figure 2. High [Ca2+]o augments PMCA modulation independently of changes in global [Ca2+]i
TG-pretreated cells were exposed sequentially to 2 and 20 mm Ca2+o as shown in Fig. 1B. A, distribution of the plateau [Ca2+]i levels generated by 20 mm Ca2+o relative to 2 mm Ca2+o in 265 individual cells. In 16% of the cells, 2 and 20 mm Ca2+o evoked the same global [Ca2+]i plateau (‘iso-[Ca2+]i’ cells; shaded bar). B, average [Ca2+]i responses from the iso-[Ca2+]i cells identified in A. Ca2+ clearance rates indicated by the thickened lines were measured over the first 5 s following Ca2+o removal (left). Clearance was faster following exposure to higher [Ca2+]o, despite constant global [Ca2+]i. An overlay of the first 5 s of Ca2+ clearance following the 2 and 20 mm Ca2+o applications, highlights the different PMCA rates (right).
Figure 3
Figure 3. High [Ca2+]o increases PMCA modulation independently of global [Ca2+]i in the majority of cells treated with La3+ to reduce Ca2+ influx
TG-treated cells were exposed to 2 mm Ca2+o or 20 mm Ca2+o + 7 nm La3+ as indicated in B. A, distribution of the plateau [Ca2+]i levels generated by 20 mm Ca2+o + 7 nm La3+ relative to 2 mm Ca2+o in 373 cells. Iso-[Ca2+]i cells (68% of the population) are indicated by the shaded bars. B, average [Ca2+]i responses from the iso-[Ca2+]i cells identified in A. Ca2+ clearance rates measured over a 5 s period are indicated by the thickened lines (left) and are plotted on an expanded scale (right).
Figure 4
Figure 4. 2-APB enhances PMCA modulation independently of changes in [Ca2+]i and [Ca2+]o
A, 2-APB increases the rate of Ca2+ clearance. Following store depletion with 1 μm TG, cells were exposed to 2 mm Ca2+o for 300 s and following an 8 min recovery period, with 2 mm Ca2+o + 5 μm 2-APB. Slopes during the first 5 s after Ca2+o removal are indicated as thickened lines (left) and on an expanded scale (right). Average response of 112 cells. B, 2-APB does not affect pump activity directly. 2-APB (5 μm) was added during the washout of Ca2+o. Clearance rates were unaffected, as shown by the equal slopes (thickened lines to the left, expanded scale to the right). C, distribution of the plateau [Ca2+]i levels generated by 2 mm Ca2+o+ 2-APB relative to 2 mm Ca2+o alone from the experiment in A. Iso-[Ca2+]i cells are indicated by the shaded bars. D, average response of the iso-[Ca2+]i cells identified in C (left). 2-APB enhanced the clearance rate 1.7-fold despite the absence of any change in global [Ca2+]i. An overlay of the first 5 s of Ca2+ clearance following applications of 2 mm Ca2+ ± 2-APB highlights the different PMCA rates (right).
Figure 5
Figure 5. Increasing the electrical driving force for Ca2+ enhances PMCA modulation
After establishing the perforated-patch voltage-clamp configuration, single indo-1-loaded cells were treated with 1 μm TG for 10 min to activate CRAC channels at a holding potential of +30 mV to maintain resting [Ca2+]i levels. Antimycin (2 μm) + oligomycin (2 μm) were present to block mitochondrial Ca2+ uptake. A, PMCA activity is voltage independent. Hyperpolarization from +30 mV to −70 mV evoked a [Ca2+]i rise to 1.4 μm in ∼10 s. Subsequent removal of Ca2+o caused [Ca2+]i to decay back to baseline; the dotted line indicates a single-exponential fit to the recovery phase. Changing the holding potential from −70 to +30 mV did not significantly alter the rate of Ca2+ clearance. B, hyperpolarization increases PMCA activity with little change in global [Ca2+]i. Hyperpolarization of the holding potential (VHOLD, bottom) evoked an increase in ICRAC (middle, measured at the holding potential) and [Ca2+]i (top). Leak-subtracted ramp current at −80 to +50 mV (inset) was collected during the period at −50 mV VHOLD. The ramps display the inward rectification and positive reversal potential characteristic of ICRAC. Increasing VHOLD from −50 to −75 mV almost doubled ICRAC with only a slight elevation of [Ca2+]i, implying an increase of PMCA activity.
Figure 6
Figure 6. Local [Ca2+]i gradients near CRAC channels and possible modes of coupling to PMCAs
A, estimate of the [Ca2+]i gradient in a microdomain around a single CRAC channel using eqn (1) (see text). The 2 mm Ca2+o condition was simulated using a unitary CRAC current of −1.5 fA (Zweifach & Lewis, 1993), and this value was scaled by 1.8 to simulate 20 mm; Ca2+o conditions, based on a Kd for conduction of 2 mm (Premack et al. 1994). Global [Ca2+]i = 1 μm; Ca2+ diffusion coefficient, DCa = 300 μm2 s−1. B, possible models for local control of PMCA modulation by Ca2+ influx through CRAC channels. Close physical coupling of PMCAs and CRAC channels may expose PMCAs directly to local [Ca2+]i microdomains which enhance pump modulation. Alternatively, a Ca2+ sensor may receive the local Ca2+ signal, and via diffusion may modulate PMCAs located at more distant sites.

References

    1. Almers W, Neher E. The Ca signal from fura-2 loaded mast cells depends strongly on the method of dye-loading. FEBS Lett. 1985;192:13–18. - PubMed
    1. Apicella S, Chen S, Bing R, Penniston JT, Llinas R, Hillman DE. Plasmalemmal ATPase calcium pump localizes to inner and outer hair bundles. Neuroscience. 1997;79:1145–1151. - PubMed
    1. Augustine GJ, Neher E. Neuronal Ca2+ signalling takes the local route. Curr Op Neurobiol. 1992;2:302–307. - PubMed
    1. Aussel C, Marhaba R, Pelassy C, Breittmayer JP. Submicromolar La3+ concentrations block the calcium release-activated channel, and impair CD69 and CD25 expression in CD3- or thapsigargin-activated Jurkat cells. Biochem J. 1996;313:909–913. - PMC - PubMed
    1. Bakowski D, Parekh AB. Monovalent cation permeability and Ca2+ block of the store-operated Ca2+ current ICRAC in rat basophilic leukemia cells. Pflugers Arch. 2002;443:892–902. - PubMed

Publication types

MeSH terms

LinkOut - more resources