Review
. 2004 Feb;2(2):E22.
doi: 10.1371/journal.pbio.0020022. Epub 2004 Feb 17.

pRb inactivation in mammary cells reveals common mechanisms for tumor initiation and progression in divergent epithelia

Affiliations
Review

pRb inactivation in mammary cells reveals common mechanisms for tumor initiation and progression in divergent epithelia

Karl Simin et al. PLoS Biol. 2004 Feb.

Abstract

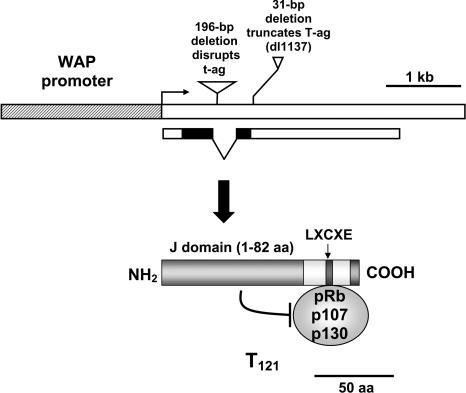
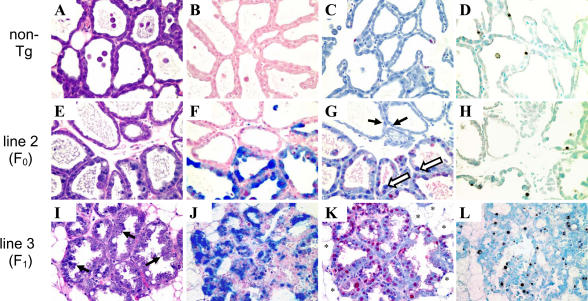
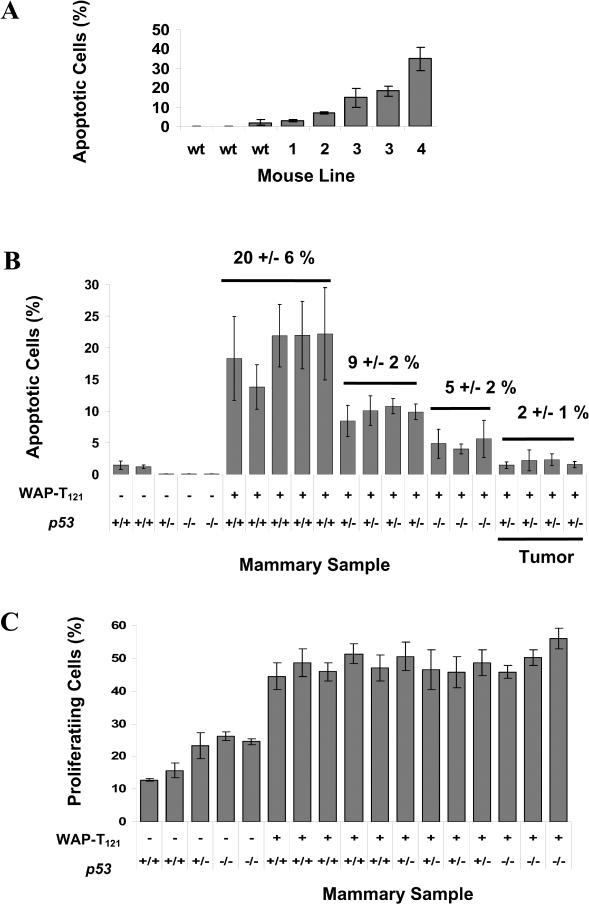
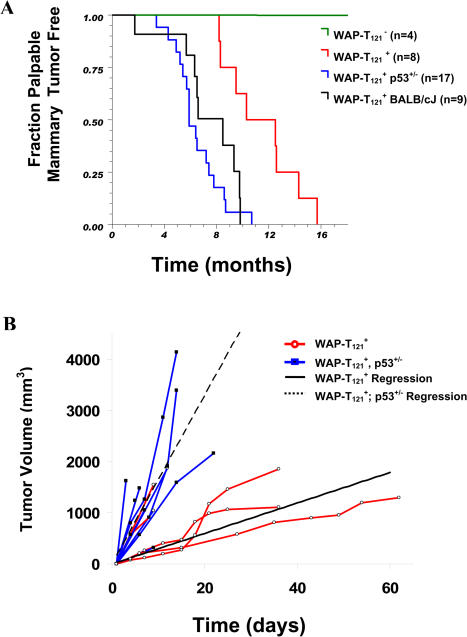
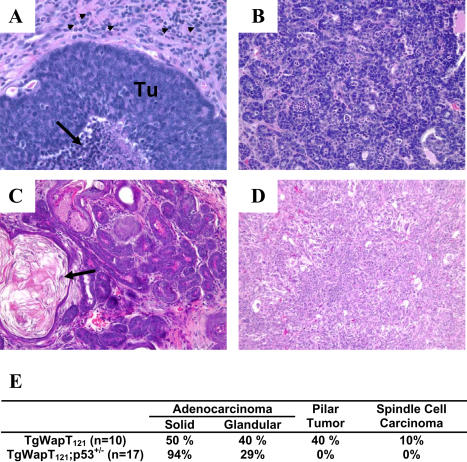
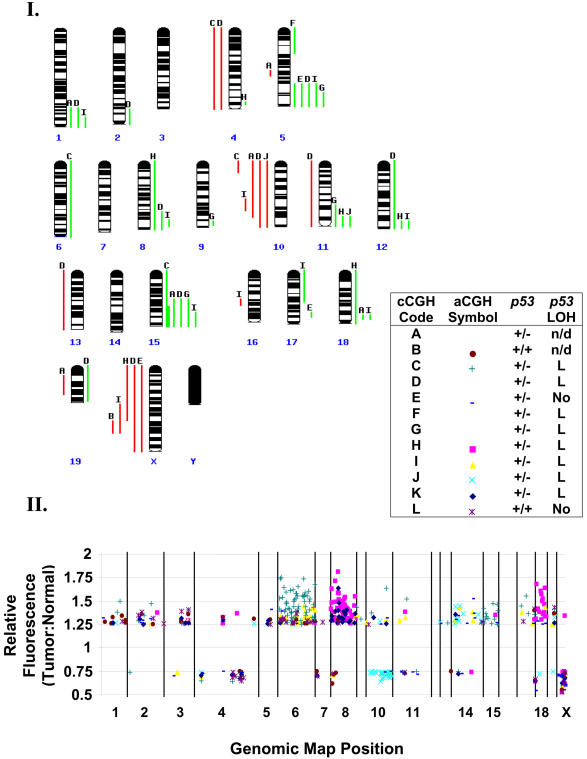
Retinoblastoma 1 (pRb) and the related pocket proteins, retinoblastoma-like 1 (p107) and retinoblastoma-like 2 (p130) (pRb(f), collectively), play a pivotal role in regulating eukaryotic cell cycle progression, apoptosis, and terminal differentiation. While aberrations in the pRb-signaling pathway are common in human cancers, the consequence of pRb(f) loss in the mammary gland has not been directly assayed in vivo. We reported previously that inactivating these critical cell cycle regulators in divergent cell types, either brain epithelium or astrocytes, abrogates the cell cycle restriction point, leading to increased cell proliferation and apoptosis, and predisposing to cancer. Here we report that mouse mammary epithelium is similar in its requirements for pRb(f) function; Rb(f) inactivation by T(121), a fragment of SV40 T antigen that binds to and inactivates pRb(f) proteins, increases proliferation and apoptosis. Mammary adenocarcinomas form within 16 mo. Most apoptosis is regulated by p53, which has no impact on proliferation, and heterozygosity for a p53 null allele significantly shortens tumor latency. Most tumors in p53 heterozygous mice undergo loss of the wild-type p53 allele. We show that the mechanism of p53 loss of heterozygosity is not simply the consequence of Chromosome 11 aneuploidy and further that chromosomal instability subsequent to p53 loss is minimal. The mechanisms for pRb and p53 tumor suppression in the epithelia of two distinct tissues, mammary gland and brain, are indistinguishable. Further, this study has produced a highly penetrant breast cancer model based on aberrations commonly observed in the human disease.


Conflict of interest statement

The authors have declared that no conflicts of interest exist.

Figures

Figure 1
Figure 1. Diagram of the WAP-T121 Transgene and Protein
The fragment consists of the 2.4 kb WAP promoter (hatched) and the mutant SV40 T-antigen coding region (white box) containing two deletions, the 196-bp amino-terminal deletion, which abolishes small t antigen production, and the dl1137 deletion, which truncates T antigen. Both the J domain and the LXCXE domain are required for pRb family inactivation (see Materials and Methods).
Figure 2
Figure 2. Expression of T121 Protein in WAP-T121 Mice and a Summary of Gross Phenotypes
As expected, each line showed mammary-specific expression following lactation induction, while line 4 showed more widespread expression, with protein detected in brain and kidney. Mice from the higher-expressing lines 3 and 4 failed to nurse because of lactation defects. Mammary glands of adult female mice from all four lines showed elevated proliferation and apoptosis. Glands from line 1 and 2 mice were hyperplastic, while glands from lines 3 and 4 were atrophic. Lines 3 and 4 later developed carcinomas and other neoplasms. T121 protein was detected by Western blot analysis in lactating mammary glands of animals from all four lines (B), although the lower-expressing lines 1 and 2 required immunoprecipitation with anti-T-antigen antibody prior to Western blot analysis (right panel in [B]). Brain tumor extract (see Materials and Methods) was used for a positive control, and nontransgenic mammary tissue extract was used for a negative control. A timecourse analysis of T121 expression (C) shows lactation-induced expression peaking at 5 d postpartum. Abbreviations: Adeno-Ca, adenocarcinoma; AP, elevated apoptosis in mammary gland; At, atrophy; dpc, postcoital; FTN, failure to nurse; Hyp, hyperplastic acini; MG, mammary gland; MIN, mammary epithelia neoplasia; ND, not determined; nt, nontransgenic; pp, postpartum; Pr, elevated proliferation in mammary gland; pw, post-weaning. Footnotes: aMosaic founder animal.bAt earlier stages, development defects attributed to atrophy, while MIN and adenocarcinoma were observed at terminal stages.cApproximately half of progeny died of unknown cause.
Figure 3
Figure 3. Mammary-Specific Inactivation of the pRb Pathway Induces Extensive Abnormalities
Histologic comparisons of nontransgenic (A–D), mosaic (F0 line 2 [E–H]), and transgenic (F1, line 3 [I–L]) lactating mammary glands reveals that T121 expression results in increased proliferation and apoptosis. Hemotoxylin and eosin staining shows acini of the normal lactating gland are composed of a single layer of secretory epithelial cells (A) with milk-filled lumen. Consistent with atrophy, transgenic animals have a lower density of acini demonstrated by the presence of lipid-filled adipocytes (asterisk in [K]). Acini composed of T121-expressing cells are atypical. Many are collapsed and composed of tall columnar epithelia of large hyperchromatic cells with papillary tufting (arrows in [I]). Transgene-expressing cells have large pleomorphic nuclei (open arrows in [G]) as compared to nuclei of nonexpressing cells (arrows in [G]). Staining for T121 expression (blue in [B]–[J]) indicates the line 2 F0 animal is mosaic, showing localized expression (F), whereas the transgene expresses throughout the gland of an F1 line 3 animal (J). Increased proliferation assayed by PCNA staining (red) is also localized in the mosaic founder (G), but found throughout the F1 transgenic gland (K). Similarly, TUNEL staining (brown) demonstrates increased apoptosis in transgenic animals (H and L); moreover, the regionalized apoptosis in the mosaic gland (H) strongly suggests that transgene expression and not precocious involution is the cause. All samples are from primiparous females on lactation day 1.
Figure 4
Figure 4. Reduced p53 Activity Decreases Apoptosis but Does Not Increase Proliferation
Representative apoptosis levels of each mouse line correlate with T121 expression as indicated by the percentage of TUNEL positive cells (A). Decreasing levels of p53 activity correlate with lower levels of apoptosis in transgenic mammary glands (B). The mean percentage of apoptotic cells in p53 wild-type transgenic glands was 21%; in p53 heterozygous animals, 9%; and in p53 null animals, 5% (B), indicating that 75% of the apoptosis is p53-dependent. Apoptosis levels are further reduced to 2% in terminal stage tumors (B, Tumors). The percentage of PCNA staining cells remains unchanged in p53 heterozygous or nullizygous animals (C), indicating that reduction of p53 activity levels had no significant impact on cell proliferation. Samples were derived from primiparous animals on lactation day 1, except as indicated as tumor samples (B). Transgenic animals in (B) and (C) were from line 3.
Figure 5
Figure 5. Mammary Tumor Onset and Growth Are Accelerated by p53 Reduction
Among line 3 animals, the median time following initial transgene induction until a palpable tumor appeared was 10 mo, and within 16 mo, all mice developed palpable tumors (red line in [A]). In p53+/− transgenic animals (blue line in [A]), mammary tumors were detected significantly earlier (p < 0.0003) with a median onset of 6 mo. Among mice with BALB/cJ background (black line in [A]), median mammary tumor latency (8.5 mo) was significantly shorter (p = 0.0077) compared to mice of the hybrid BDF1 background strain and indistinguishable (p = 0.2466) from WAP-T 121 ;p53+/− mice. Once palpable, WAP-T 121 ;p53+/− tumors grew faster than the p53 wild-type counterparts (B). The average growth rates for p53+/+ (black solid) and p53+/− (dashed) are indicated.
Figure 6
Figure 6. Tumor Morphologies
Hemotoxylin and eosin staining of WAP-T121 (C and D) and WAP-T 121 p53+/− (A and B) (also representative of WAP-T121) tumor sections shows that terminal stage adenocarcinomas have varied morphologies. Poorly differentiated solid tumors were comprised of nests (A) or cords of epithelial cells (Tu) that infiltrate a fibrous stroma and were accompanied by necrosis (arrow) and strong immune response (arrowheads). Moderately differentiated glandular tumors (B) consisted of irregular, disorganized glands. In animals of wild-type p53 background, four pilar tumors (C), distinguished by swirls of laminar acellular keratin (arrow), and a single spindle cell carcinoma (D) were also observed. For comparison, a lactating gland from a wild-type animal is shown in Figure 3A. The percentage of animals displaying each of the phenotypes is summarized in (G). Since many tumors shared multiple morphologies, the sum exceeds 100%.
Figure 7
Figure 7. CGH Analysis Shows Limited Genomic Instability
Twelve tumors were analyzed by CGH: ten by cCGH (Panel I, A–J), eight by aCGH (Panel II, B, C, E, and H–L), and six by both procedures (Panels I and II, B, C, E, and H–J). In Panel I, green and red lines adjacent to the ideograms indicate relative gain or loss, respectively. Tumor sample identities are indicated by letters above gain and loss lines. Only a single sample (Panel I, D) shows loss of Chromosome 11. Telomeric sequences of many chromosomes are increased, most frequently Chromosomes 5 and 15. Recurrent losses are seen on Chromosomes 10 and X. For aCGH (Panel II), the genomic map is depicted with chromosomes horizontally aligned centromere to telomere. The relative fluorescence intensities (tumor:normal) are indicated along the vertical axis. Individual BACs are plotted according to their physical map position versus relative fluorescence, with sample identities indicated by a unique symbol for each tumor. To simplify visualization, only BACs with relative intensities greater than 1.25 (gains) or less than 0.75 (losses) are shown. X Chromosome values were halved to account for sex-mismatched samples. Changes spanning the entire length of the chromosome are readily detected on Chromosomes 6, 8, 10, 15, 18, and X. None of the clones showing loss on Chromosome 11 spans the p53 locus. The original p53 background of the animal and the p53 LOH status of each tumor are also indicated in the legend.

References

    1. Brehm A, Miska EA, McCance DJ, Reid JL, Bannister AJ, et al. Retinoblastoma protein recruits histone deacetylase to repress transcription. Nature. 1998;391:597–601. - PubMed
    1. Buckley MF, Sweeney KJ, Hamilton JA, Sini RL, Manning DL, et al. Expression and amplification of cyclin genes in human breast cancer. Oncogene. 1993;8:2127–2133. - PubMed
    1. Chen J, Tobin G, Pipas JM, Van Dyke TA. T antigen mutant activities in transgenic mice: Roles of p53 and pRb-binding in tumorigenesis of the choroid plexus. Oncogene. 1992;7:1167–1175. - PubMed
    1. Dannenberg JH, van Rossum A, Schuijff L, te Riele H. Ablation of the retinoblastoma gene family deregulates G(1) control causing immortalization and increased cell turnover under growth-restricting conditions. Genes Dev. 2000;14:3051–3064. - PMC - PubMed
    1. DeCaprio JA, Ludlow JW, Lynch D, Furukawa Y, Griffin J, et al. The product of the retinoblastoma susceptibility gene has properties of a cell-cycle regulatory element. Cell. 1989;58:1085–1095. - PubMed

Publication types