Review
. 2004 Feb;2(2):E29.
doi: 10.1371/journal.pbio.0020029. Epub 2004 Feb 17.

Functional bias and spatial organization of genes in mutational hot and cold regions in the human genome

Affiliations
Review

Functional bias and spatial organization of genes in mutational hot and cold regions in the human genome

Jeffrey H Chuang et al. PLoS Biol. 2004 Feb.

Abstract

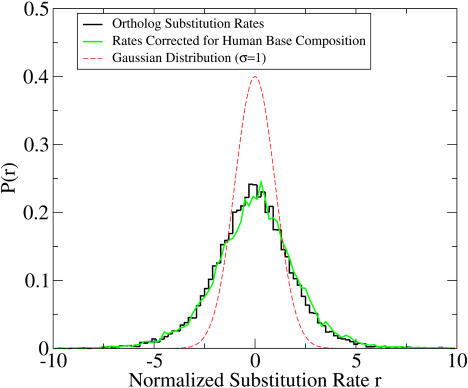
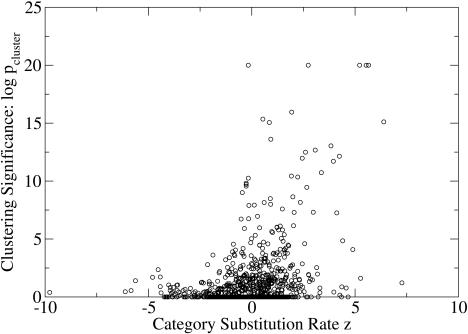
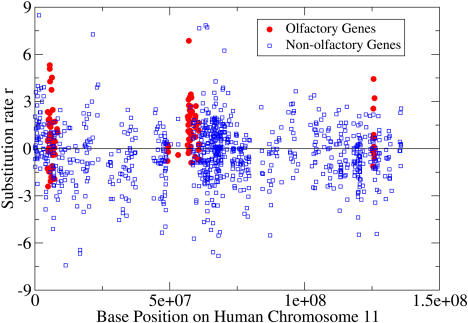
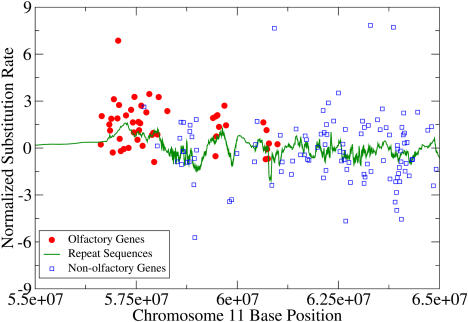
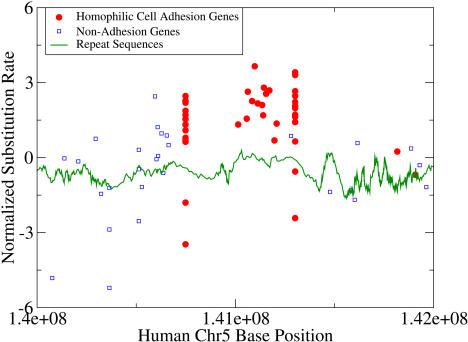
The neutral mutation rate is known to vary widely along human chromosomes, leading to mutational hot and cold regions. We provide evidence that categories of functionally related genes reside preferentially in mutationally hot or cold regions, the size of which we have measured. Genes in hot regions are biased toward extracellular communication (surface receptors, cell adhesion, immune response, etc.), while those in cold regions are biased toward essential cellular processes (gene regulation, RNA processing, protein modification, etc.). From a selective perspective, this organization of genes could minimize the mutational load on genes that need to be conserved and allow fast evolution for genes that must frequently adapt. We also analyze the effect of gene duplication and chromosomal recombination, which contribute significantly to these biases for certain categories of hot genes. Overall, our results show that genes are located nonrandomly with respect to hot and cold regions, offering the possibility that selection acts at the level of gene location in the human genome.


Conflict of interest statement

The authors have declared that no conflicts of interest exist.

Figures

Figure 1
Figure 1. Distribution of Normalized Substitution Rates
Histogram of substitution rates based on 14,790 orthologous mouse and human genes (black curve). The rate distribution has significantly more genes at high and low rates than the expected Normal distribution (red curve). This bias toward high and low rates remains even when rates are corrected for human base composition (green curve).
Figure 2
Figure 2. Clustering versus Substitution Rate for GO Categories Containing at Least Five Members
Virtually all clustered gene categories have higher than average substitution rates (z > 0).
Figure 3
Figure 3. Clustering of Olfactory Genes on Human Chromosome 11
The olfactory genes are clustered into three regions along the chromosome. The substitution rates of the olfactory genes are almost all hot, while the nonolfactory genes are distributed around r = 0.
Figure 4
Figure 4. Olfactory Genes Lie in a Mutational Hot Spot
Substitution rates of the olfactory genes in the central region of human Chromosome 11. The substitution rate of ancestral repeat sequences is higher in the region where the olfactory genes lie.
Figure 5
Figure 5. Homophilic Cell Adhesion Genes Also Lie in a Hot Spot
Substitution rates of a cluster of homophilic cell adhesion genes on human Chromosome 5, along with substitution rates of other genes and ancestral repeat sequences. The repeat sequence substitution rate plateaus at a higher level in this region.
Figure 6
Figure 6. Correlation Length Analysis of Substitution Rates
Correlation of substitution rates in syntenous blocks as a function of distance between genes measured along the human chromosome (top) and measured along the mouse chromosome (bottom). There are two length scales of correlation decay: a short one of 1 Mb and a long one of 10 Mb. The curve fits are for <r(0)r(t)> = A 0 exp (−t/τ) + A for the region t ∈ [0, 10000000] .

References

    1. Alberts B, Bray D, Lewis J, Raff M, Roberts K, et al. Vol. 1. New York: Garland Publishing; 1994. Molecular biology of the cell; 616 pp.
    1. Altschul SF, Gish W, Miller W, Meyers EW, Lipman DJ. Basic local alignment search tool. J Mol Biol. 1990;215:403–410. - PubMed
    1. Ashburner M, Ball CA, Blake JA, Botstein D, Butler H, et al. Gene ontology: Tool for the unification of biology—The Gene Ontology Consortium. Nat Genet. 2000;25:25–29. - PMC - PubMed
    1. Bernardi G. Isochores and the evolutionary genomics of vertebrates. Gene. 2000;241:3–17. - PubMed
    1. Casane D, Boissinot S, Chang BH-J, Shimmin LC, Li WH. Mutation pattern among regions of the primate genome. J Mol Evol. 1997;45:216–226. - PubMed

Publication types