. 2004 Feb;2(2):E45.
doi: 10.1371/journal.pbio.0020045. Epub 2004 Feb 17.

Learning-induced improvement in encoding and decoding of specific movement directions by neurons in the primary motor cortex

Affiliations

Learning-induced improvement in encoding and decoding of specific movement directions by neurons in the primary motor cortex

Rony Paz et al. PLoS Biol. 2004 Feb.

Abstract

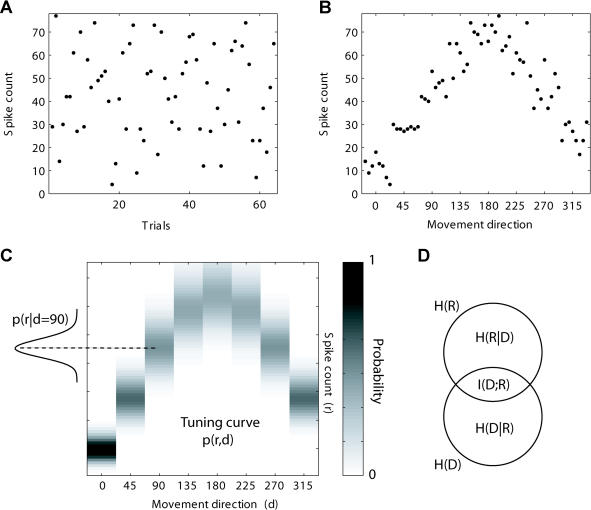
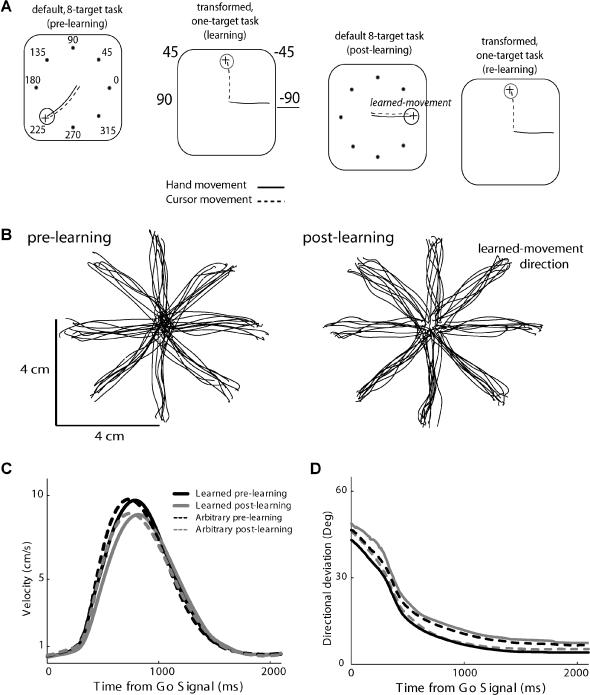
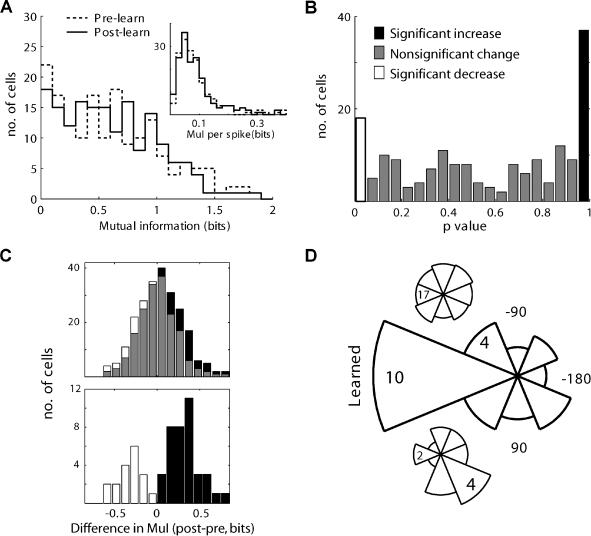
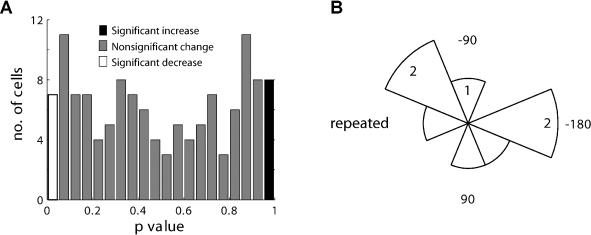
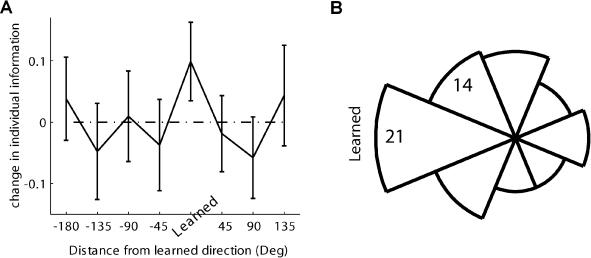
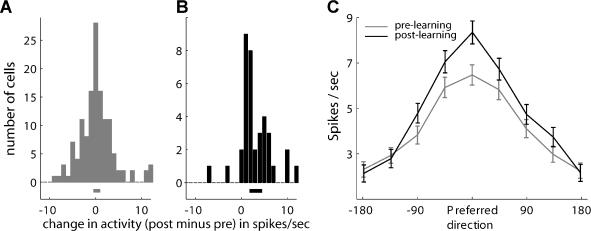
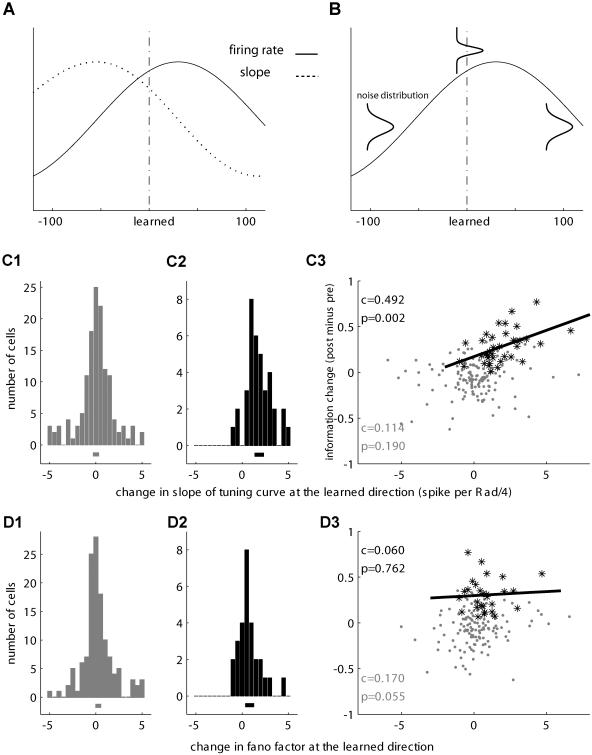
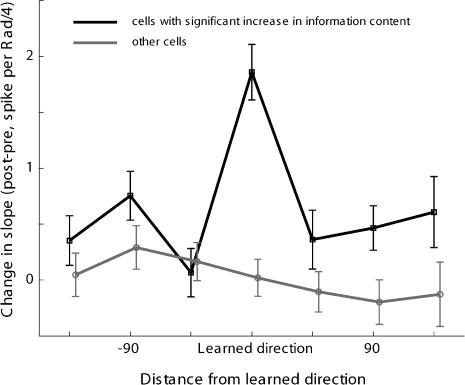
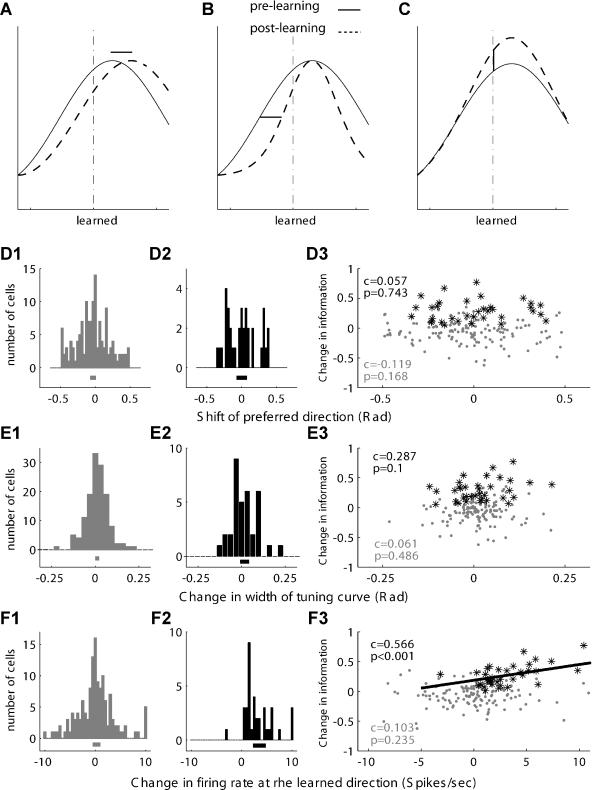
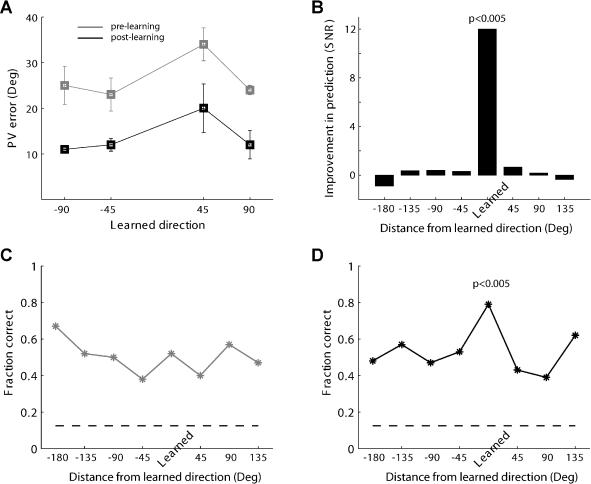
Many recent studies describe learning-related changes in sensory and motor areas, but few have directly probed for improvement in neuronal coding after learning. We used information theory to analyze single-cell activity from the primary motor cortex of monkeys, before and after learning a local rotational visuomotor task. We show that after learning, neurons in the primary motor cortex conveyed more information about the direction of movement and did so with relation to their directional sensitivity. Similar to recent findings in sensory systems, this specific improvement in encoding is correlated with an increase in the slope of the neurons' tuning curve. We further demonstrate that the improved information after learning enables a more accurate reconstruction of movement direction from neuronal populations. Our results suggest that similar mechanisms govern learning in sensory and motor areas and provide further evidence for a tight relationship between the locality of learning and the properties of neurons; namely, cells only show plasticity if their preferred direction is near the training one. The results also suggest that simple learning tasks can enhance the performance of brain-machine interfaces.


Conflict of interest statement

The authors have declared that no conflicts of interest exist.

Figures

Figure 2
Figure 2. MuI between Neuronal Activity and Direction of Movement
The example shows a simulation of the activity of one cell during 64 movements to evenly spaced eight directions, presented in a random order (eight trials per direction). Each dot in the raster plots a and b describes the spike count of the cell in a specific trial. Without prior knowledge about the direction of movement (A), a large uncertainty exists about the responses of the neuron. However, ordering the trials according to the movement direction (B) reveals a large reduction in the uncertainty about the cell responses. The probability p(r,d) of observing a trial with direction d and spike count r is shown in (C); along with a specific conditional distribution p(r|d 0 = 90) . The entropy is a measure of the uncertainty about movement direction: H(D) = log(8) = 3 bits, in the case that all eight directions have equal probability to occur. The conditional entropy is defined as and describes the mean uncertainty about direction given the cell response. The MuI I(R;D) = H(D) − H(D|R) measures the reduction in uncertainty about movement direction given the response of the cell. The MuI is symmetric, in the sense that it also measures the reduction in uncertainty about cell response given the direction of movement I(R;D) = H(D) − H(D|R) . This relation is graphically depicted in (D).
Figure 1
Figure 1. Behavioral Paradigm and Movement Kinematics
(A) Session flow (left to right). Every session (day) consisted of pre-learning, learning, post-learning, and relearning epochs. Pre- and post-learning epochs were standard eight-target tasks with a default (one-to-one) mapping between cursor movement and the movement of the hand. In the learning epoch, only one target (upwards) appeared, and a visuomotor rotational transformation was imposed on the relationship between movement of the hand and cursor movement. The example shown is for a transform of −90° (seeMaterials and Methods for a full description). (B–D) Similar kinematics pre- and post-learning. (B) Example of 1-day trajectories from the two epochs; the transform in this session was of –45°. (C) Velocity profiles. Peak velocity was slightly lower in the post-learning epoch (t-test, p = 0.05), but no difference was found between the learned direction and other directions (t-test, p = 0.3). (D) Improvement in directional deviation was calculated as the deviation of the instantaneous hand direction from the required target direction, calculated every 10 ms starting from the go-signal. All four movement types (learned and nonlearned, pre- and post-learning) exhibited the same temporal pattern. Here and for analysis of neuronal activity, we excluded the first trials in the post-learning epoch—those exhibiting significant aftereffects due to learning.
Figure 3
Figure 3. Comparing MuI of Single Cells Pre- and Post-Learning
(A) Distributions of single-cell information about direction of movement pre-learning (dashed) and post-learning (solid). No significant difference was found between the distributions (Kolmogorov–Smirnoff, p = 0.3). The inset shows the MuI per spike, calculated by dividing the information per cell by the cell's firing rate (Kolmogorov–Smirnoff, p = 0.25). (B) Improvement in information of individual cells. Histogram of p-values for all cells; a significant (p < 0.01, χ2) number of cells (n = 37) had a p-value greater than 0.95, representing cells that significantly increase their information content about direction after learning; 18 cells had a p-value lower than 0.05, representing cells that decreased their information content, but this was found to be only marginally significant (p = 0.06, χ2). (C) Histograms of difference in information, post- minus pre-learning, for all cells (upper) and only for cells that increase (p > 0.95) or decrease (p < 0.05) their information content significantly (lower). (D) Circular histogram for PD of cells that significantly increased their information. The cells' PDs were normalized to the learned direction in each cell recording session, revealing a unimodal distribution (Rayleigh test, p < 0.05). The upper inset shows the circular histogram for all cells and lower inset shows the circular histogram for cells that decreased their information; in both cases, the distributions seem homogenous (Rayleigh test, p > 0.1).
Figure 4
Figure 4. Changes Were Not Observed after Mere Repetition of Movement to One Direction
Same as in Figure 3B and 3D, but for control sessions that included the mere repetition of standard, nontransformed movement to one target during the learning epoch. The number of cells that exhibited an increase in their information content was not significant ([A] right bar, eight out of 126), and their distribution was homogenous and showed no specific relation to the direction of the repeated movement (B).
Figure 5
Figure 5. Comparing Individual DI
(A) Mean (with 95% confidence intervals, by fitting a Gaussian distribution) of post-learning information minus pre-learning information for one direction. Abscissa represents the distance from the learned-movement direction; all directions were normalized according to the learned direction in the cell's session. An increase is evident only for the learned-movement direction, with mean at 0.1 and 95% confidence intervals at 0.036 and 0.164. (B) Circular histogram of PDs for cells with a positive difference of post-learning minus pre-learning information about the learned direction (Rayleigh test, p = 0.01).
Figure 6
Figure 6. Learning-Induced Elevation of Information and Activity
(A and B) Histograms of changes in firing rate in the PD (post-learning minus pre-learning) for all the cells (A) and for cells that significantly increased their information (B). The horizontal line below the histogram represents its mean and the 95% confidence intervals, by fitting a Gaussian distribution. (C) Average tuning curves (baseline subtracted, ± SEM) of cells that significantly increased their information (n = 37). Comparing pre-learning (gray) and post-learning (black). Cell tuning curves were first aligned to each cell's PD.
Figure 7
Figure 7. Increased Slope of Tuning Curve Is Correlated with the Increase in Information
Possible mechanisms for improving the information content of single cells. (A and C) The slope of the tuning curve at the learned direction indicates the magnitude of change in activity in response to small changes in direction. The higher slope suggests that nearby directions can be discriminated better. (B and D) Reliability of coding. The variability at each direction indicates how well different directions can be differentiated based on single trials. (C1 and D1) Histograms of the difference between pre- and post-learning for the corresponding mechanism for the whole population of cells. The horizontal line below the histogram represents its mean and the 95% confidence intervals. (C2 and D2) Histograms for cells that significantly increased their information about direction. (C3 and D3) Correlation between the difference in information (post- minus pre-learning) and the corresponding mechanism. Gray dots are all the cells, and black asterisks are cells that significantly increased their information content. The black line represents the linear regression fit. The corresponding Pearson correlation (C) and its significance (p-value) are designated. The histogram in (C2) is shifted to the right, indicating that cells that increased their information content also increased the slope of the tuning curve in the learned direction. In these cells only, a significant (p = 0.002) correlation coefficient (c = 0.492) was found.
Figure 8
Figure 8. Slope Increase Is Specific to the Learned Direction
Mean change (± SEM) in the slope of the tuning curve surrounding each direction, for cells that significantly increased their information content (black) and for the rest of the cells (gray).
Figure 9
Figure 9. Increased Information after Learning Is Correlated with Elevation of Firing Rate in the Learned Direction
Possible mechanisms for increased slope of the tuning curve in the learned direction. (A and D) Shift of PD, i.e., shifting the whole tuning curve, may position the learned direction at a higher slope location. (B and E) Narrowing of the tuning curve, as measured by the width at half-height. (C and F) Local changes (Increase) in activity in the learned direction can increase the slope. This is similar to the observed learning-induced changes in our data (see Figure 6C). In (A)–(C), an illustration of the measured difference is indicated. (D1–D3, E1–E3, and F1–F3) Same format as in Figure 4 for the three possible mechanisms. The histogram in (F2) is shifted to the right, indicating that cells that increased their information content also elevated their firing rate in the learned direction. In these cells only a significant (p < 0.001) correlation coefficient (c = 0.566) was found (F3, asterisks and line).
Figure 10
Figure 10. Improved Decoding of Movement Direction Only for the Learned Direction
(A and B) Using PV. (A) PV errors given as the distance in degrees between the predicted and the actual direction for the four learned-movement directions (± SEM, bootstrap test). (B) Signal-to-noise ratio (mean/SD) of PV improvement (pre-learning deviation minus post-learning deviation) for all directions (four learned directions are pooled together and all other directions are normalized to them). A significant improvement was observed only for the learned direction (p < 0.005, Bonferoni correction for multiple tests, i.e., the eight directions). (C and D) Using a MAP estimator, we predicted 100 times the actual hand direction using neuronal activity. Shown is the fraction of correct predictions for pre-learning (C) and post-learning (D). A significant increase was observed only for the learned direction (p < 0.005, Bonferoni correction for multiple tests, i.e., the eight directions). The dashed line is the chance level (0.125).

References

    1. Alexander GE, Crutcher MD. Preparation for movement: Neural representations of intended direction in three motor areas of the monkey. J Neurophysiol. 1990;64:133–150. - PubMed
    1. Berry MJ, Warland DK, Meister M. The structure and precision of retinal spike trains. Proc Natl Acad Sci U S A. 1997;94:5411–5416. - PMC - PubMed
    1. Buracas GT, Zador AM, DeWeese MR, Albright TD. Efficient discrimination of temporal patterns by motion-sensitive neurons in primate visual cortex. Neuron. 1998;20:959–969. - PubMed
    1. Chen LL, Wise SP. Evolution of directional preferences in the supplementary eye field during acquisition of conditional oculomotor associations. J Neurosci. 1996;16:3067–3081. - PMC - PubMed
    1. Chen LL, Wise SP. Conditional oculomotor learning: Population vectors in the supplementary eye field. J Neurophysiol. 1997;78:1166–1169. - PubMed

Publication types