. 2004 Feb;113(4):635-45.
doi: 10.1172/JCI20518.

Gluco-incretins control insulin secretion at multiple levels as revealed in mice lacking GLP-1 and GIP receptors

Affiliations

Gluco-incretins control insulin secretion at multiple levels as revealed in mice lacking GLP-1 and GIP receptors

Frédéric Preitner et al. J Clin Invest. 2004 Feb.

Abstract

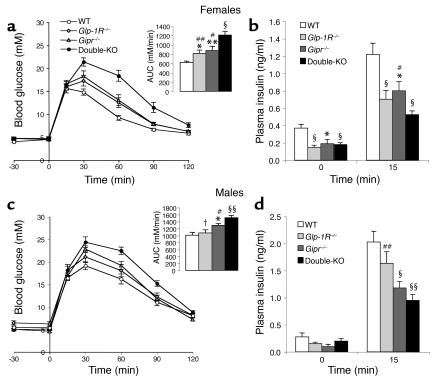
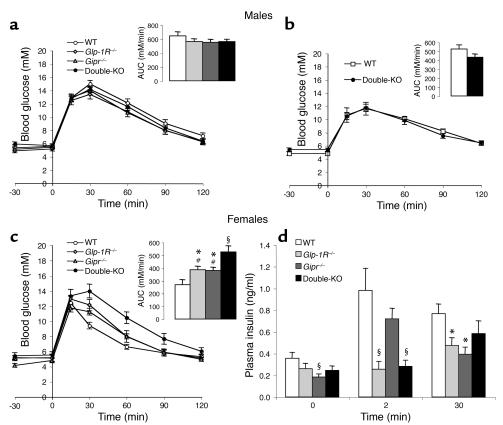
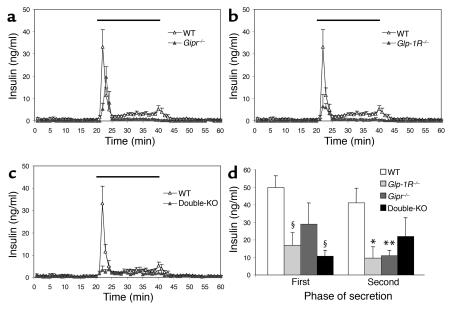
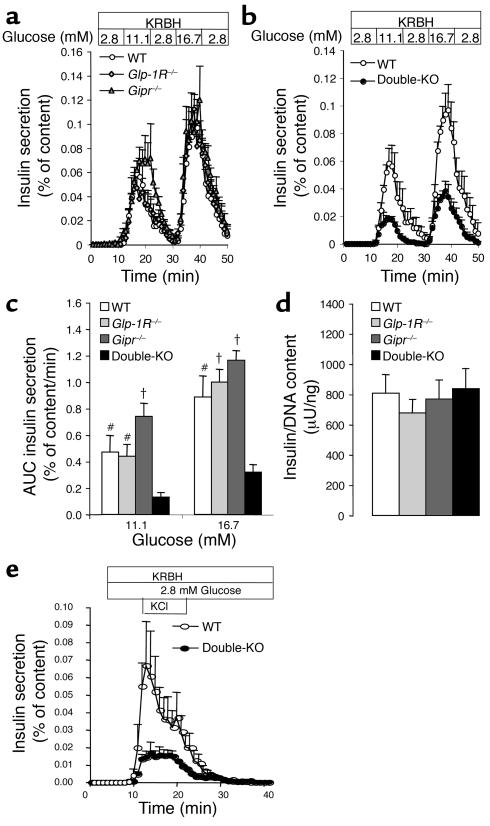
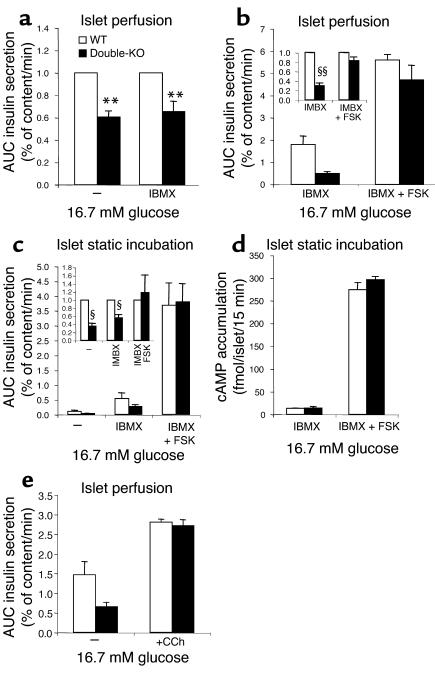
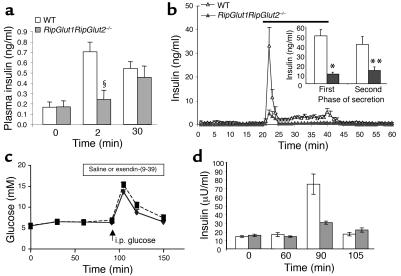
The role of the gluco-incretin hormones GIP and GLP-1 in the control of beta cell function was studied by analyzing mice with inactivation of each of these hormone receptor genes, or both. Our results demonstrate that glucose intolerance was additively increased during oral glucose absorption when both receptors were inactivated. After intraperitoneal injections, glucose intolerance was more severe in double- as compared to single-receptor KO mice, and euglycemic clamps revealed normal insulin sensitivity, suggesting a defect in insulin secretion. When assessed in vivo or in perfused pancreas, insulin secretion showed a lack of first phase in Glp-1R(-/-) but not in Gipr(-/-) mice. In perifusion experiments, however, first-phase insulin secretion was present in both types of islets. In double-KO islets, kinetics of insulin secretion was normal, but its amplitude was reduced by about 50% because of a defect distal to plasma membrane depolarization. Thus, gluco-incretin hormones control insulin secretion (a) by an acute insulinotropic effect on beta cells after oral glucose absorption (b) through the regulation, by GLP-1, of in vivo first-phase insulin secretion, probably by an action on extra-islet glucose sensors, and (c) by preserving the function of the secretory pathway, as evidenced by a beta cell autonomous secretion defect when both receptors are inactivated.


Figures

Figure 1
Figure 1
Generation of Gipr–/– mice. (a) Diagram showing the mouse GIP-receptor gene, the GIP-receptor targeting vector, and the recombined allele. The genomic fragments diagnostic of homologous recombination using the external StuI-NheI probe are shown at the bottom of the figure. Positions of exons are marked as light gray boxes. In the mutant allele the AflII site denoted with * is replaced by a HindIII site on the 3′ end of the pgkNeo gene (marked with **). In the targeting vector, the arrows indicate the transcriptional orientation of the selection genes. (b) Southern blot analysis of the recombined alleles in mouse genomic DNA using the StuI-NheI probe. (c) Confirmation of receptor gene inactivation. Perifused isolated pancreatic islets from WT, Glp-1R–/–, Gipr–/–, or double-KO mice were challenged with successive 10-minute stimulation periods to 11.1 mM glucose, 2.8 mM glucose, 11.1 mM glucose + GLP-1 (10 nM), 2.8 mM glucose, 11.1 mM glucose + GIP (10 nM), and 2.8 mM glucose. Total insulin responses, quantified as AUC, are normalized for each genotype to the insulin response at 11.1 mM glucose alone, set at 100%. n = 4. Cont, control.
Figure 2
Figure 2
Oral glucose tolerance tests (3 mg/g) in 3- to 4-month-old mice. (a and c) Glycemic excursions for (a) female WT (n = 11), Glp-1R–/– (n = 6), Gipr–/– (n = 9), and double-KO mice (n = 11) and for (c) male mice (n = 12–19). Insets: quantification of the glycemic excursions as AUC. (b and d) Basal and peak plasma insulin levels 15 minutes after gavage for (b) female WT (n = 12), Glp-1R–/– (n = 17), Gipr–/– (n = 12), and double-KO mice (n = 9), and for (d) males (n = 9–13). Data pooled from two to four separate experiments are expressed as means ± SE. *P < 0.05, **P < 0.01, §P < 0.005, §§P < 5 × 10⁻⁴ vs. WT controls; #P < 0.05, ##P < 0.01, †P < 0.005 vs. double-KO.
Figure 3
Figure 3
IPGTTs (1 mg/g). (a) Glycemic excursions in 3- to 4-month-old male WT (n = 9), Glp-1R–/– (n = 12), Gipr–/– (n = 19), and double-KO (n = 17) mice. Insets: quantification as AUC of the glycemic excursions. (b) Glycemic excursions in 10-month-old male WT (n = 6) and double-KO (n = 10) mice. Insets: quantification as AUC of the glycemic excursions. (c) Glycemic excursions in 3- to 4-month-old female WT (n = 7), Glp-1R–/– (n = 11), Gipr–/– (n = 9), and double-KO mice (n = 11). Insets: quantification as AUC of the glycemic excursions. (d) Plasma insulin levels in female mice at basal state and at 2 and 30 minutes after intraperitoneal glucose injection (n = 4–9). Data, pooled from two to four separate experiments, are expressed as means ± SE. *P < 0.05, §P < 0.005 vs WT controls. #P < 0.05 vs. double-KO.
Figure 4
Figure 4
Glucose-induced insulin secretion in perfused pancreata from (a) Gipr–/– (n = 4), (b) Glp-1R–/– (n = 4), and (c) double-KO (n = 4) mice compared to WT mice (n = 6). Pancreata were perfused with basal solution (1 mM glucose) for 30 minutes before perfusate was collected (from time 0) for analysis of secreted insulin. Glucose concentration was increased to 16.7 mM for the indicated period (dark line). (d) Quantification of AUC of first-phase (minutes 21–25) and second-phase (minutes 26–45) insulin secretion. Data are presented as means ± SEM of four to six separate experiments. *P < 0.05, ** P < 0.01, §P < 0.005 when mutant mouse results were compared to those of the WT.
Figure 5
Figure 5
Insulin secretion in perifused islets from (a) Glp-1R–/–, Gipr–/–, and (b) double-KO mice compared with WT mice. (c) Quantification as AUC of insulin responses shown in a and b. n = 4. Data are expressed as means ± SE of insulin secretion normalized to the insulin content of 30 islets. (d) Insulin content in WT, Glp-1R–/–, Gipr–/–, and double-KO isolated islets. Data are expressed as insulin content normalized to the DNA content in 30 islets. n = 5–10. (e) Insulin secretion in WT and double-KO islets perifused with 2.8 mM glucose + 30 mM KCl. Data are expressed as means ± SE of insulin secretion normalized to the insulin content of 30 islets. n = 3. #P < 0.05, †P < 0.005 vs. double-KO.
Figure 6
Figure 6
cAMP, carbachol, and insulin secretion. (a) IBMX and insulin secretion. Islets were perifused successively with 2.8 mM glucose for 10 minutes, 16.7 mM glucose for 10 minutes, 2.8 mM glucose for 20 minutes, first in the absence and then in the presence of IBMX 100 μM. Shown are the AUCs of insulin responses normalized to WT values set at 1. Absolute values of AUCs for WT are 0.32% of insulin content (without IBMX) and 0.99 % of insulin content (with IBMX). (b) Forskolin and insulin secretion. Islets were perifused in the presence of 100 μM IBMX as follows: 2.8 mM glucose for 10 minutes, 16.7 mM glucose for 10 minutes, 2.8 mM glucose for 20 minutes, 16.7 mM glucose + forskolin (10 μM) for 10 minutes, and 2.8 mM glucose for 25 minutes. Results are AUCs of insulin responses (n = 4). Inset: double-KO values normalized to WT values, set at 1. (c) Static incubations of isolated islets. Insulin secretion from 10 islets incubated for 15 minutes at 16.7 mM glucose in the presence or absence of IBMX 100 μM and forskolin (FSK) 10 μM (n = 3 separate experiments). Inset, double-KO values normalized to WT values, set at 1. (d) cAMP accumulation in 20 islets incubated in presence of IBMX 250 μM with or without forskolin 10 μM (n = 4–9, pooled from two separate experiments). Data are expressed as means ± SE of femtomoles cAMP accumulated per islet during 20 minutes. **P < 0.01, §P < 0.005, §§P < 0.001 vs. WT controls. (e) Carbachol and insulin secretion. Islets were perifused with 16.7 mM glucose in the presence or absence of carbachol (Cch, 1 μM). The data are AUCs of secreted insulin. Data are mean ± SEM (n = 3).
Figure 7
Figure 7
Glucose-induced insulin secretion in RipGlut1Glut2–/– female mice. (a) IPGTTs (1 mg/g) in RipGlut1Glut2–/– compared to C57BL/6J WT mice (n = 7). §P < 0.005. (b) Glucose-induced insulin secretion in perfused pancreata of RipGlut1Glut2–/– (n = 4) compared to WT mice (n = 6). Pancreata were perfused as described in Figure 4 (b, inset). Quantification of the AUCs corresponding to first- and second-phase insulin secretion from pancreata of WT (white bars) and RipGlut1Glut2–/– (gray bars) mice. Data are presented as means ± SEM from four to six separate experiments. *P < 0.001, **P < 0.04, for mutant vs. WT mice. (c) Glycemic profiles of control mice infused through the portal vein, between 60 and 150 minutes (open bar at the top), with saline (diamonds) or exendin-(9–39) (0.5 pmol/kg/min, squares) and receiving an intraperitoneal (i.p.) glucose injection (1 mg/g) at 90 minutes (arrow, i.p. glucose). The glycemic profiles were similar in the two groups. (d) Plasma insulin levels for the experiment presented in c. Basal (0 and 60 minutes) insulin levels were similar in both groups of mice. First peak of insulin secretion (92 minutes) was, however, strikingly reduced in exendin-(9–39)–infused mice. Plasma insulin levels at 105 minutes (i.e., 15 minutes after glucose injection) were similar in both groups of mice. These data demonstrate that inhibition of the hepatoportal vein glucose sensor significantly blunts first-phase insulin secretion after intraperitoneal glucose injection. Data are mean ± SEM with n = 7 and n = 5 for saline- and exendin-(9–39)–infused mice, respectively.

References

    1. Ebert R, Creutzfeldt W. Gastrointestinal peptides and insulin secretion. Diabetes Metab. Rev. 1987;3:1–16. - PubMed
    1. Creutzfeldt W, Nauck M. Gut hormones and diabetes mellitus. Diabetes Metab. Rev. 1992;8:149–177. - PubMed
    1. Mojsov S, Weir GC, Habener JF. Insulinotropin: glucagon-like peptide 1 (7–37) co-encoded in the glucagon gene is a potent stimulator of insulin release in the perfused rat pancreas. J. Clin. Invest. 1987;79:616–619. - PMC - PubMed
    1. Weir GC, Mojsov S, Hendrick GK, Habener JF. Glucagon-like peptide 1 (7–37) actions on endocrine pancreas. Diabetes. 1989;38:338–342. - PubMed
    1. Thorens B. Expression cloning of the pancreatic beta cell receptor for the gluco-incretin hormone glucagon-like peptide I. Proc. Natl. Acad. Sci. U.S.A. 1992;89:8641–8645. - PMC - PubMed

Publication types

MeSH terms