. 2004 Mar;74(3):495-510.
doi: 10.1086/382284. Epub 2004 Feb 13.

Incorporating genotyping uncertainty in haplotype inference for single-nucleotide polymorphisms

Affiliations

Incorporating genotyping uncertainty in haplotype inference for single-nucleotide polymorphisms

Hosung Kang et al. Am J Hum Genet. 2004 Mar.

Abstract

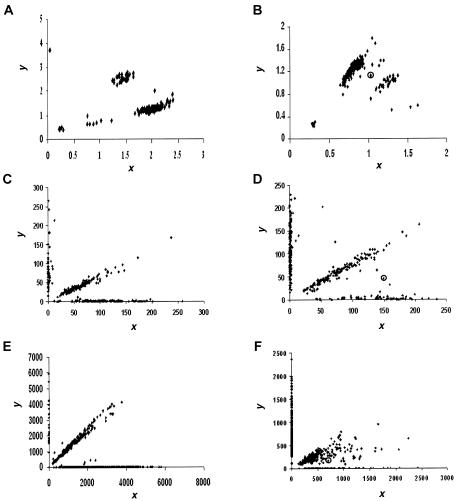
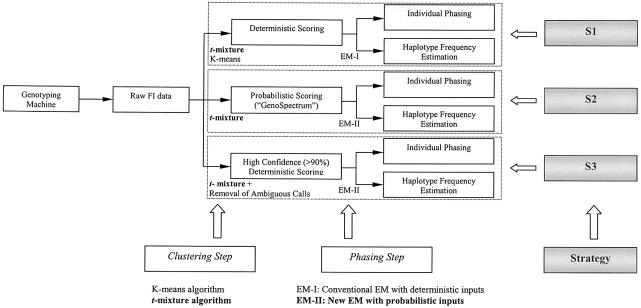
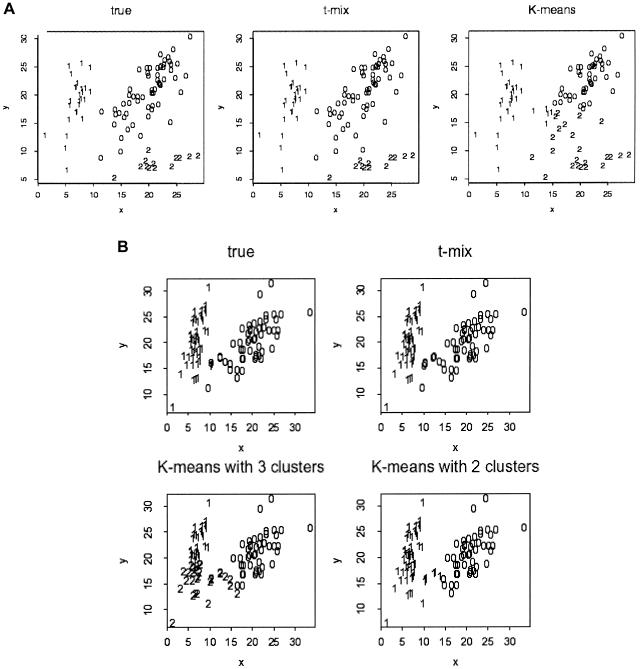
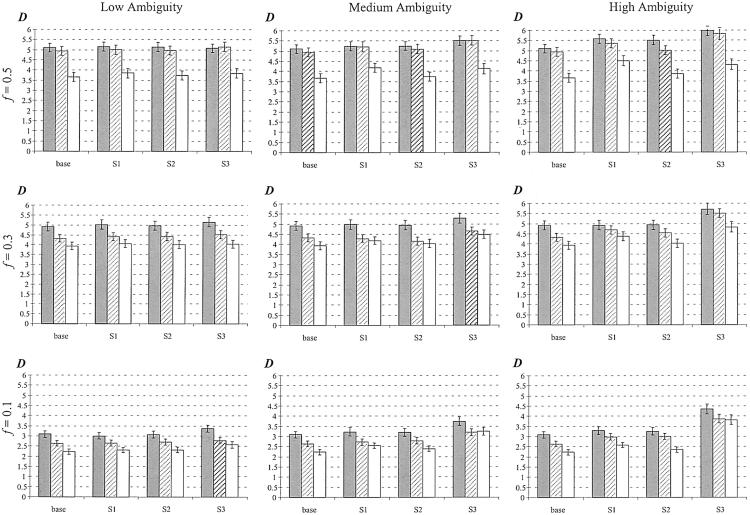
The accuracy of the vast amount of genotypic information generated by high-throughput genotyping technologies is crucial in haplotype analyses and linkage-disequilibrium mapping for complex diseases. To date, most automated programs lack quality measures for the allele calls; therefore, human interventions, which are both labor intensive and error prone, have to be performed. Here, we propose a novel genotype clustering algorithm, GeneScore, based on a bivariate t-mixture model, which assigns a set of probabilities for each data point belonging to the candidate genotype clusters. Furthermore, we describe an expectation-maximization (EM) algorithm for haplotype phasing, GenoSpectrum (GS)-EM, which can use probabilistic multilocus genotype matrices (called "GenoSpectrum") as inputs. Combining these two model-based algorithms, we can perform haplotype inference directly on raw readouts from a genotyping machine, such as the TaqMan assay. By using both simulated and real data sets, we demonstrate the advantages of our probabilistic approach over the current genotype scoring methods, in terms of both the accuracy of haplotype inference and the statistical power of haplotype-based association analyses.


Figures

Figure  1
Figure 1
Scatterplots of FI readouts from genotyping a marker by use of various assays. Each point (x, y) represents the genotype of an individual, where x and y denote the FI values for the two alleles, respectively. A, A typical good result from the TaqMan assay. Four distinct clusters are shown, corresponding to major-allele homozygotes, minor-allele homozygotes, heterozygotes, and NFS. B, A typical but not ideal result from the TaqMan assay. It is difficult to separate all points into distinct clusters. The point in a circle is located between two groups of dense points, demonstrating the case in which a clear-cut genotype call is difficult to make. C, A typical good result from the OLA. The three genotype clusters are in the form of three straight lines: the one close to the x-axis and the one close to the y-axis correspond to major and minor homozygotes respectively, and the center line corresponds to heterozygotes. The points near the origin indicate experimental failures, resulting in NFS. D, A typical but not ideal result from the OLA. The points located between line patterns demonstrate the cases in which a clear-cut genotype call is difficult to make. E, A typical good result from the MassARRAY assay. The scatterplot looks similar to the ones obtained from the OLA. F, A typical but not ideal result from the MassARRAY assay. The points that are located between the genotype line patterns are the cases in which a clear-cut genotype call is difficult to make.
Figure  2
Figure 2
A, Illustration of the genotype clusters on 2-D fluorescent intensity plots. A = wild-type allele; a = variant allele. B, Illustrations of the simulated FI scatterplots that mimic the real data at low, medium, and high ambiguity levels.
Figure  3
Figure 3
Schematic diagram for strategies S1, S2, and S3. Each strategy consists of two steps: a clustering step and a phasing step. For each strategy, the raw FI scatter data were used, and both individual phasing and haplotype frequency estimation were achieved. S3 mimics the human “best guess” strategy. S1 and S3 output deterministic calls, and S2 outputs probabilistic genotype calls. The new algorithms introduced in this article are in boldface type.
Figure  4
Figure 4
Comparisons of the K-means algorithm and the t-mixture algorithm. Each point (x, y) represents the genotype of an individual, where x and y denote the FI values for the two alleles, respectively. The cluster label is shown for each data point for the ground truth, as well as the clustering results of the bivariate t-mixture model (“t-mix”) and the K-means algorithm. A, A three-cluster example. B, A two-cluster example. Note that the K-means algorithm requires the user to prespecify the number of clusters, whereas the t-mixture algorithm can determine the number of clusters automatically.
Figure  5
Figure 5
Performance comparison of haplotype frequency estimations of the three strategies. The vertical axis measures discrepancy is formula image, the scaled absolute difference between the estimated and the true haplotype frequencies. The error bars are shown as ±1 SE. S1, S2, and S3 represent competing strategies shown in figure 3, and “base” refers to the use of true genotype calls to feed in the EM-based haplotype phasing algorithms. A total of 100 data sets were generated for each calculation, and each simulated data set contained 100 individuals. The gray bar represents low LD (D=0–0.5), the hatched bar represents medium LD (D=0.5–0.75), and the unshaded bar represents high LD (D=0.75–0.95). f = minor-allele frequency.

References

Electronic-Database Information

    1. Authors' Web site, http://www.people.fas.harvard.edu/~junliu/genotype/ (for the GeneScore [probabilistic genotype clustering method using the t-mixture model] and GS-EM [the EM algorithm for haplotype phasing with multilocus GenoSpectrum inputs] software packages, their detailed instructions, and sample input and output files)

References

    1. Abecasis GR, Cherny SS, Cardon LR (2001) The impact of genotyping error on family-based analysis of quantitative traits. Eur J Hum Genet 9:130–134 - PubMed
    1. Akey JM, Zhang K, Xiong M, Doris P, Jin L (2001) The effect that genotyping errors have on the robustness of common linkage-disequilibrium measures. Am J Hum Genet 68:1447–1456 - PMC - PubMed
    1. Akula N, Chen YS, Hennessy K, Schulze TG, Singh G, McMahon FJ (2002) Utility and accuracy of template-directed dye-terminator incorporation with fluorescence-polarization detection for genotyping single nucleotide polymorphisms. Biotechniques 32:1072–1078 - PubMed
    1. Buetow KH (1991) Influence of aberrant observations on high resolution linkage analysis outcome. Am J Hum Genet 49:985–994 - PMC - PubMed
    1. Clark AG (1990) Inference of haplotypes from PCR-amplified samples of diploid populations. Mol Biol Evol 7:111–122 - PubMed

Publication types

LinkOut - more resources