. 2004 Mar;5(3):280-4.
doi: 10.1038/sj.embor.7400090. Epub 2004 Feb 13.

The yeast coexpression network has a small-world, scale-free architecture and can be explained by a simple model

Affiliations

The yeast coexpression network has a small-world, scale-free architecture and can be explained by a simple model

Vera van Noort et al. EMBO Rep. 2004 Mar.

Abstract

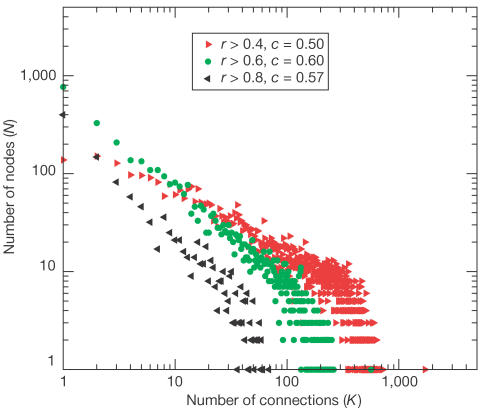
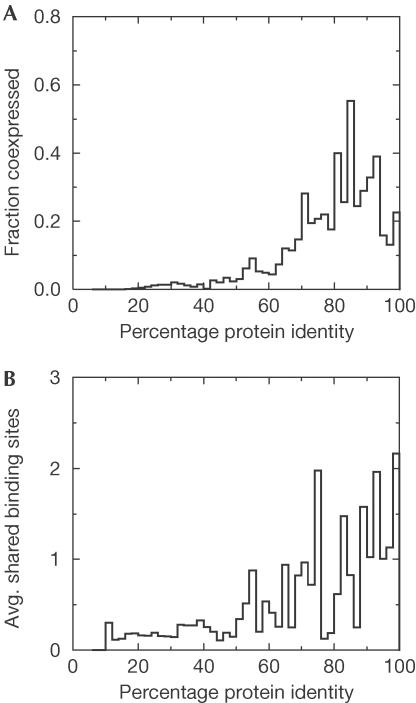
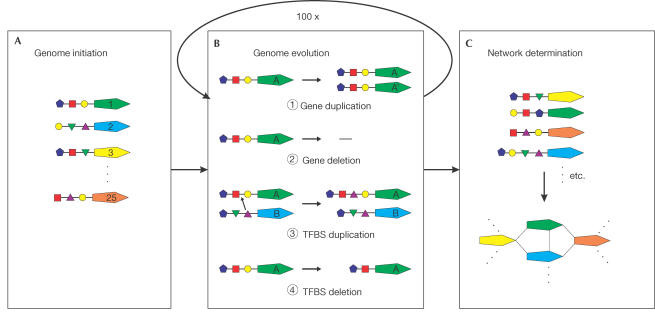
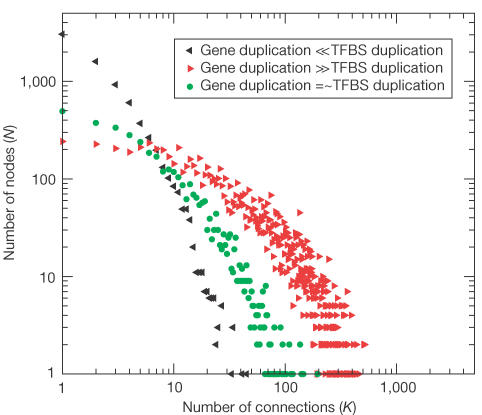
We investigated the gene coexpression network in Saccharomyces cerevisiae, in which genes are linked when they are coregulated. This network is shown to have a scale-free, small-world architecture. Such architecture is typical of biological networks in which the nodes are connected when they are involved in the same biological process. Current models for the evolution of intracellular networks do not adequately reproduce the features that we observe in the network. We therefore derive a new model for its evolution based on the observation that there is a positive correlation between the sequence similarity of paralogues and their probability of coexpression or sharing of transcription factor binding sites (TFBSs). The simple, neutralist's model consists of (1) coduplication of genes with their TFBSs, (2) deletion and duplication of individual TFBSs and (3) gene loss. A network is constructed by connecting genes that share multiple TFBSs. Our model reproduces the scale-free, small-world architecture of the coregulation network and the homology relations between coregulated genes without the need for selection either at the level of the network structure or at the level of gene regulation.


Figures

Figure 1
Figure 1
Distribution of connections per node in the coexpression network. Nodes are genes and connections are defined by coexpression of two genes, resulting in a network. The number of nodes (N) with a certain number of connections (k) in the coexpression network is shown, where coexpression is defined by a correlation in expression pattern higher than 0.4 (right-pointing arrows), 0.6 (circles) or 0.8 (left-pointing arrows). The distributions at thresholds 0.6 and 0.8 are scale free with an exponent γ≈1.
Figure 2
Figure 2
Coexpression between paralogues in experiments. (A) Fractions of coexpressed paralogues calculated by correlation in coexpression in the data set of Hughes et al (2000). (B) Average number of shared regulatory elements between paralogues in the data set of Lee et al (2002).
Figure 3
Figure 3
Evolutionary model of transcription regulation. The evolutionary model consists of a few simple mechanisms. (A) A genome is initiated with 25 genes with random TFBSs, represented by the small coloured shapes. (B) Possible events are as follows: (1) Gene A is duplicated, gene A′ has the same TFBS as its duplicate gene A; the duplicates are coexpressed. (2) Gene deletion. (3) Gene A acquires a new TFBS from gene B. The probability of obtaining a specific TFBS is proportional to its frequency in the genome. The probability of a novel TFBS is (150 − total number of different TFBSs present)/(150+total number of TFBSs). (4) One of the TFBSs of gene A is deleted. (C) A network is constructed by connecting genes that share TFBSs.
Figure 4
Figure 4
Distribution of connections per node in the simulated network. The number of nodes (N) with a certain number of connections (k) in the simulated network is shown. The minimum number of shared TFBSs for a connection in the network is three. Gene duplication and deletion are in the same order of magnitude as TFBS duplication and deletion (circles), gene duplication and deletion are much smaller than TFBS duplication and deletion (left-pointing arrows), and gene duplication and deletion are much larger than TFBS duplication and deletion (right-pointing arrows).

References

    1. Aloy P, Russell RB ( 2002) Potential artefacts in protein-interaction networks. FEBS Lett 530: 253–254 - PubMed
    1. Amaral LA, Scala A, Barthelemy M, Stanley HE ( 2000) Classes of small-world networks. Proc Natl Acad Sci USA 97: 11149–11152 - PMC - PubMed
    1. Barabasi AL, Albert R ( 1999) Emergence of scaling in random networks. Science 286: 509–512 - PubMed
    1. Bhan A, Galas DJ, Dewey TG ( 2002) A duplication growth model of gene expression networks. Bioinformatics 18: 1486–1493 - PubMed
    1. Brummelkamp TR, Bernards R ( 2003) New tools for functional mammalian cancer genetics. Nat Rev Cancer 3: 781–789 - PubMed

Publication types

Substances

LinkOut - more resources