. 2004 Feb;25(2):201-9.

Diffusion-weighted imaging in the follow-up of treated high-grade gliomas: tumor recurrence versus radiation injury

Affiliations

Diffusion-weighted imaging in the follow-up of treated high-grade gliomas: tumor recurrence versus radiation injury

Patrick A Hein et al. AJNR Am J Neuroradiol. 2004 Feb.

Abstract

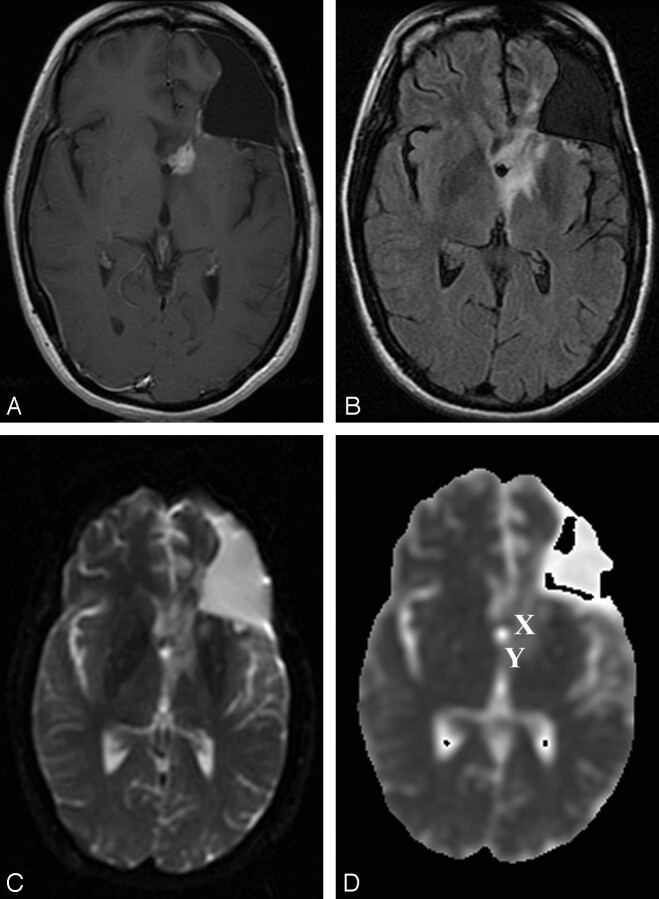
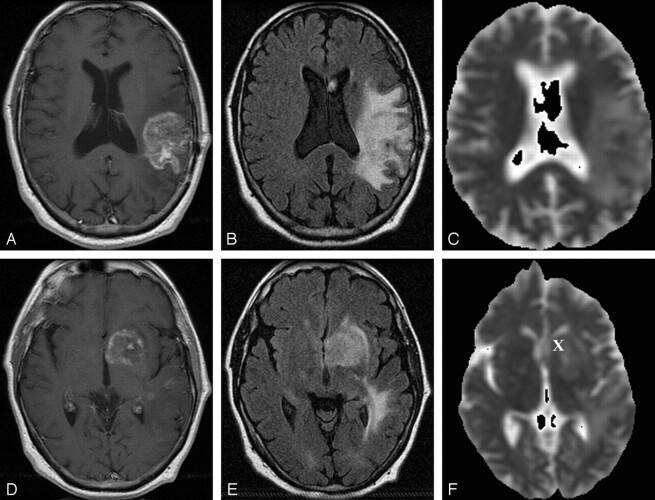
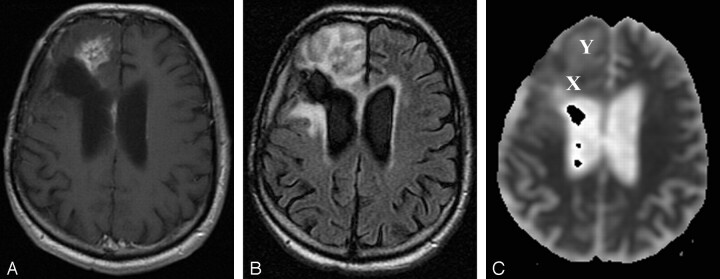
Background and purpose: Diffusion-weighted (DW) MR imaging is a means to characterize and differentiate morphologic features, including edema, necrosis, and tumor tissue, by measuring differences in apparent diffusion coefficient (ADC). We hypothesized that DW imaging has the potential to differentiate recurrent or progressive tumor growth from treatment-induced damage to brain parenchyma in high-grade gliomas after radiation therapy.

Methods: We retrospectively reviewed follow-up conventional and DW MR images obtained starting 1 month after completion of radiation treatment with or without chemotherapy for histologically proved high-grade gliomas. Eighteen patients with areas of abnormal enhancing tissue were identified. ADC maps were calculated from echo-planar DW images, and mean ADC values and ADC ratios (ADC of enhancing lesion to ADC of contralateral white matter) were compared with final diagnosis. Recurrence was established by histologic examination or by clinical course and a combination of imaging studies.

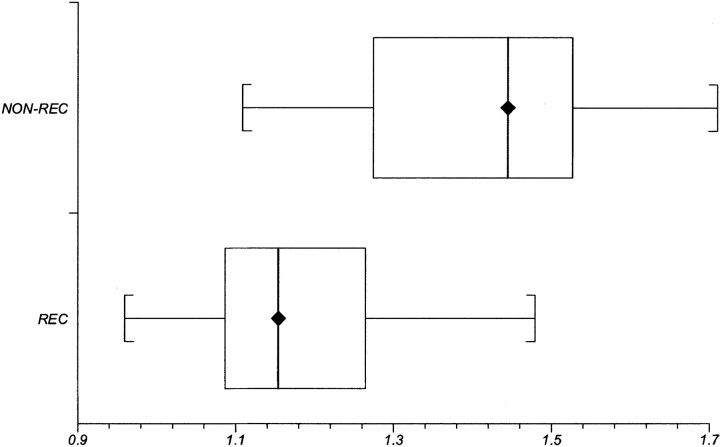
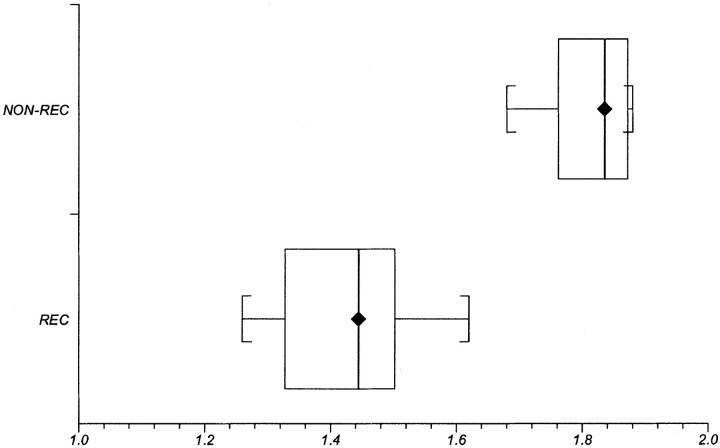
Results: Recurrence and nonrecurrence could be differentiated by using mean ADC values and ADC ratios. ADC ratios in the recurrence group showed significantly lower values (mean +/- SD, 1.43 +/- 0.11) than those of the nonrecurrence group (1.82 +/- 0.07, P <.001). Mean ADCs of the recurrent tumors (mean +/- SD, 1.18 +/- 0.13 x 10(-3) mm/s(2)) were significantly lower than those of the nonrecurrence group (1.40 +/- 0.17 x 10(-3) mm/s(2), P <.006).

Conclusion: Assessment of ADC ratios of enhancing regions in the follow-up of treated high-grade gliomas is useful in differentiating radiation effects from tumor recurrence or progression.


Figures

F<sc>ig</sc> 1.
Fig 1.
Patient 16 (nonrecurrence group). A–C, Gadolinium-enhanced T1-weighted (400/14) (A), FLAIR (10,002/175/2200) (B), and DW echo-planar (10000/114.5, b = 1000 s/mm2) (C) representative axial MR images obtained at follow-up after radiation therapy show a small periventricular enhancing lesion in the left frontal lobe, with a surrounding area of T2 prolongation on the FLAIR image consistent with perifocal edema. Postsurgical changes include an area of prior resection of the primary neoplasm (anaplastic astrocytoma) in the left frontal lobe. Enhancement resolved after hyperbaric oxygen therapy. D, ADC map from the DW image (b = 0, 1000 S/mm2). This patient from the nonrecurrence group exhibited a mean ADC in the enhancing lesion of 1.33 × 10⁻³ mm/s2, a mean ADC in T2 prolongation of 0.91 × 10⁻³ mm/s2, and a normalized ADC ratio of the enhancing region of 1.87. X indicates ROI of the enhancing lesion; Y, ROI in T2 prolongation.
F<sc>ig</sc> 2.
Fig 2.
Representative follow-up axial MR images after combined therapy for glioblastoma multiforme in patient 8 (recurrence group). A–C, Gadolinium-enhanced T1-weighted MR image (400/14) (A), FLAIR MR image (10,002/175/22000) (B), and ADC map from DW image (b = 0, 1000 s/mm2) (C) obtained at 7-month follow-up after radiation treatment show a left parietotemporal mass with surrounding T2 prolongation. D–F, Gadolinium-enhanced T1-weighted MR image (400/14) (D), FLAIR MR image (10,002/175/22000 (E), and ADC map from DW image (b = 0, 1000 s/mm2) (F) show a new focus of enhancement in the left basal ganglia at 7-month follow-up after radiation treatment. Further follow-up imaging (not shown) revealed marked progression of enhancement and T2 prolongation. Patient had progressive functional deterioration in clinical course. This patient from the recurrence group exhibited a mean ADC in the enhancing lesion of 1.13 × 10⁻³ mm/s2, a mean ADC in T2 prolongation of 1.64 × 10⁻³ mm/s2, and a normalized ADC ratio of the enhancing region of 1.35. X indicates ROI of the enhancing lesion. ROI in T2 prolongation was drawn in a different section.
F<sc>ig</sc> 3.
Fig 3.
Patient 12 (recurrence group). A and B, Gadolinium-enhanced T1-weighted (400/14) (A) and FLAIR (10,002/175/2200) (B) representative axial MR images obtained at follow-up show a focus of enhancement close to the resection site (resection of an anaplastic astrocytoma) in the right frontal lobe, with surrounding T2 prolongation. Marked progression of enhancement and perifocal edema were noted on further follow-up images (not shown). Patient had progressive functional deterioration in clinical course, and chemotherapy was restarted. C, ADC map from DW image (b = 0, 1000 s/mm2). This patient from the recurrence group exhibited a mean ADC in the enhancing lesion of 1.26 × 10⁻³ mm/s2, a mean ADC in T2 prolongation of 1.51 × 10⁻³ mm/s2, and a normalized ADC ratio of the enhancing region of 1.62. X indicates ROI of the enhancing lesion; Y, ROI in T2 prolongation.
F<sc>ig</sc> 4.
Fig 4.
Box and whisker plot compares mean ADC values between the recurrence (REC) and nonrecurrence (NON-REC) groups. Brackets indicate the range of data; boxes represent the distance between the first and third quartiles, with the median between them marked with a diamond.
F<sc>ig</sc> 5.
Fig 5.
Box and whisker plot compares ADC ratios between the recurrence (REC) and nonrecurrence (NON-REC) groups. Brackets indicate the range of data; boxes represent the distance between the first and third quartiles, with the median between them marked with a diamond.
F<sc>ig</sc> 6.
Fig 6.
A, Recurrent neoplasm in patient 6. Photomicrograph (hematoxylin-eosin stain; original magnification, X120) shows the lesion was a pleomorphic, hypercellular astrocytic neoplasm (arrow) with areas of tumor necrosis and prominent endothelial proliferation. B, Histology of treatment effects in patient 13. Photomicrograph (Hematoxylin-eosin stain; original magnification, X120) of biopsy specimen in this patient from the nonrecurrence group shows reactive gliosis and radiation changes, with necrosis of nonneoplastic brain.

Similar articles

Cited by

References

    1. Samnick S, Bader JB, Hellwig D, et al. Clinical value of iodine-123-alpha-methyl-L-tyrosine single-photon emission tomography in the differential diagnosis of recurrent brain tumor in patients pretreated for glioma at follow-up. J Clin Oncol 2002;20:396–404 - PubMed
    1. Langleben DD, Segall GM. PET in differentiation of recurrent brain tumor from radiation injury. J Nucl Med 2000;41:1861–1867 - PubMed
    1. Schlemmer HP, Bachert P, Henze M, et al. Differentiation of radiation necrosis from tumor progression using proton magnetic resonance spectroscopy. Neuroradiology 2002;44:216–222 - PubMed
    1. Sugahara T, Korogi Y, Tomiguchi S, et al. Posttherapeutic intraaxial brain tumor: the value of perfusion-sensitive contrast-enhanced MR imaging for differentiating tumor recurrence from nonneoplastic contrast-enhancing tissue. AJNR Am J Neuroradiology 2000;21:901–909 - PMC - PubMed
    1. Kumar AJ, Leeds NE, Fuller GN, et al. Malignant gliomas: MR imaging spectrum of radiation therapy- and chemotherapy-induced necrosis of the brain after treatment. Radiology 2000;217:377–384 - PubMed

MeSH terms