

Case Reports
Early diagnosis of central pontine myelinolysis with diffusion-weighted imaging
Affiliations
- PMID: 14970019
- PMCID: PMC7974598
Item in Clipboard
Case Reports
Early diagnosis of central pontine myelinolysis with diffusion-weighted imaging
AJNR Am J Neuroradiol.
2004 Feb.
Abstract
Central pontine myelinolysis (CPM) occurs in the setting of rapidly corrected hyponatremia, especially in chronically debilitated patients. Conventional CT and MR imaging findings lag the clinical manifestations of CPM. We present a case in which restricted diffusion was identified within the central pons by using MR diffusion-weighted imaging within 24 hours of onset of patient tetraplegia and before findings were conspicuous with conventional MR imaging sequences (T1, T2, and fluid-attenuated inversion recovery).
Figures
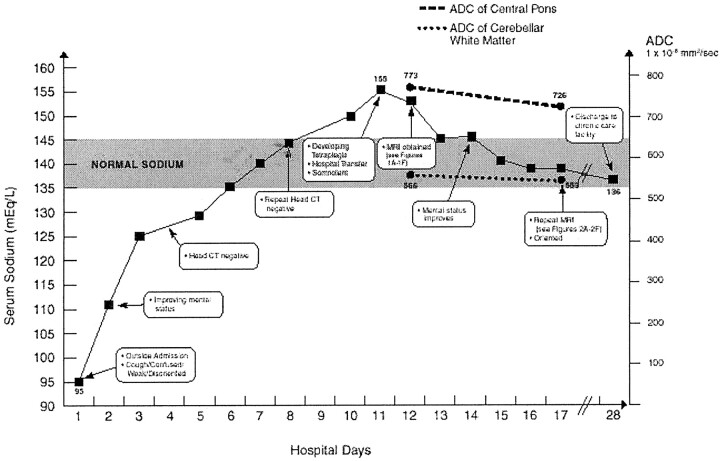
Clinical-imaging correlation plotting the patient’s serum sodium concentration, imaging studies, and quantitative ADC measurements. “Hospital days” are counted from the day the patient presented at the outside hospital with hyponatremic encephalopathy. The patient was transferred to a tertiary care center on day 11. MR image was obtained on day 12 (day following hospital transfer) and showed restricted diffusion within the central pons and no signal abnormality on the remaining conventional MR images.

MR image of the patient’s head obtained on hospital day 12, 1 day after maximum hypernatremia, and within 24 hours of onset of tetraplegia. A, FLAIR image (TR, 11,002; TE, 140; NEX, 1) is normal, as were proton density–and T2-weighted spin-echo images (not shown). B, An abnormally hyperintense finding is present within the central pons on the isotropic DWI obtained with a b value of 1000. C, There little change noted on the echo planar image obtained at b = 0. D, The ADC map shows that hyperintensity at DWI does indeed represent restricted diffusion. (See Figure 1 for quantitative ADC results.)

MR images of the patient’s head, obtained on hospital day 17, 3 days after renormalization of overcorrected hypernatremia. A, FLAIR image now demonstrates the classic trident-shaped pontine signal intensity abnormality. B, The extent of DWI signal intensity abnormality in the pons has also become more extensive, assuming a trident-shape. C, The b = 0 image has also become abnormal in the interim. D, The ADC map again shows that the high DWI signal intensity corresponds to restricted diffusion (see Figure 1).
References
-
- Menger H, Jorg J Outcome of central pontine and extrapontine myelinolysis. J Neurol 1999;246:700–705 - PubMed
-
- Kumar SR, Mone AP, Gray LC, Troost BT. Central pontine myelinolysis: delayed changes on neuroimaging. J Neuroimaging 2000;10:169–172 - PubMed
-
- Chu K, Kang DW, Ko SB. Diffusion-weighted MR findings of central pontine and extrapontine myelinolysis. Acta Neurol Scand 2001;104:385–388 - PubMed
Publication types
MeSH terms
Substances
LinkOut - more resources
Full Text Sources