. 2004 Feb 16;199(4):471-82.
doi: 10.1084/jem.20030437.

Specific regulation of T helper cell 1-mediated murine colitis by CEACAM1

Affiliations

Specific regulation of T helper cell 1-mediated murine colitis by CEACAM1

Hideki Iijima et al. J Exp Med. .

Abstract

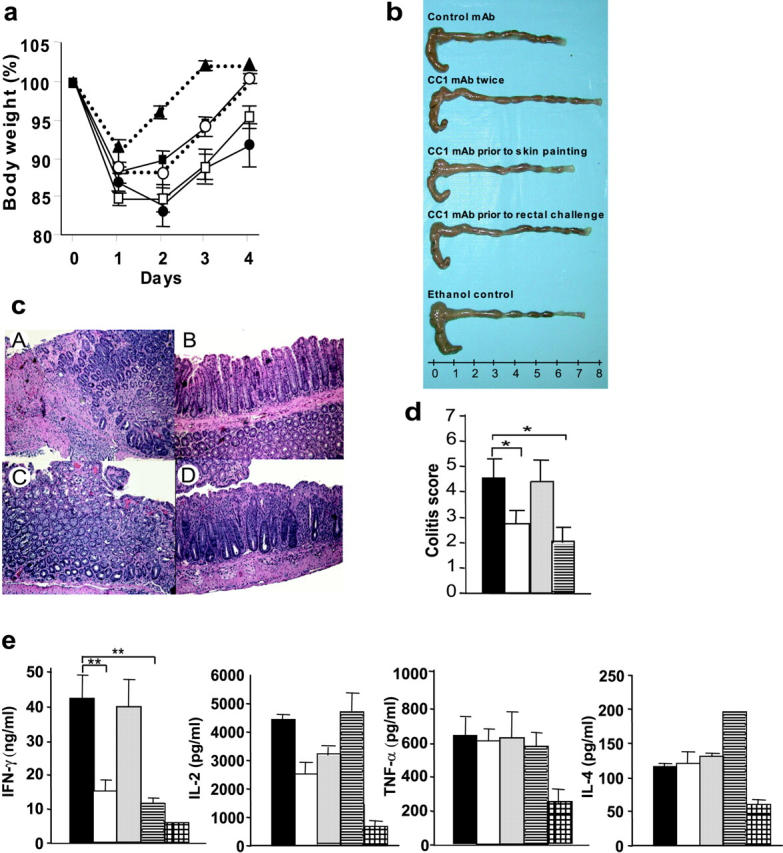
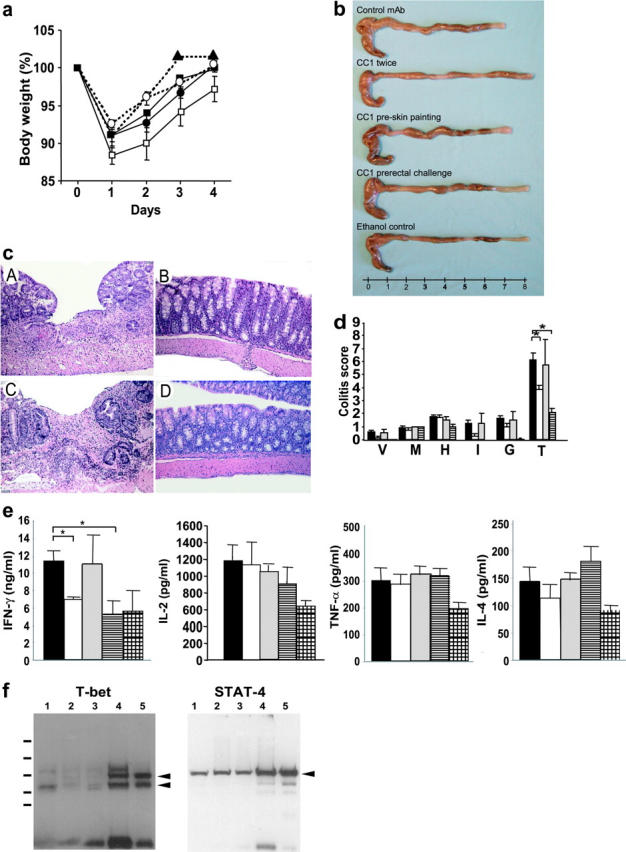
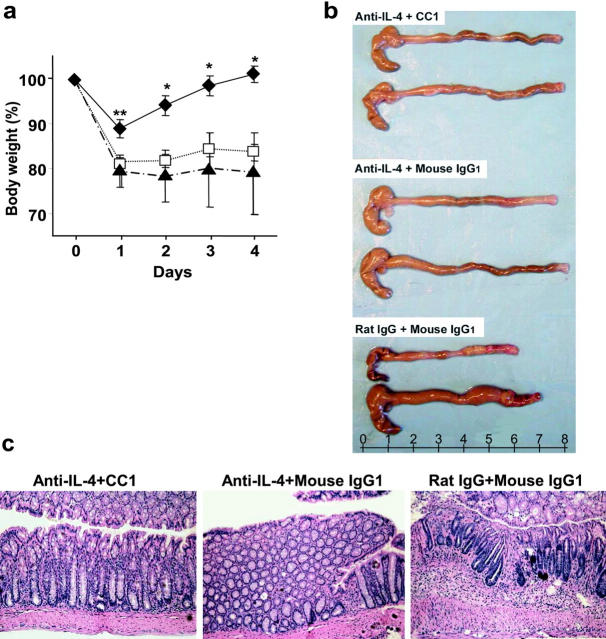
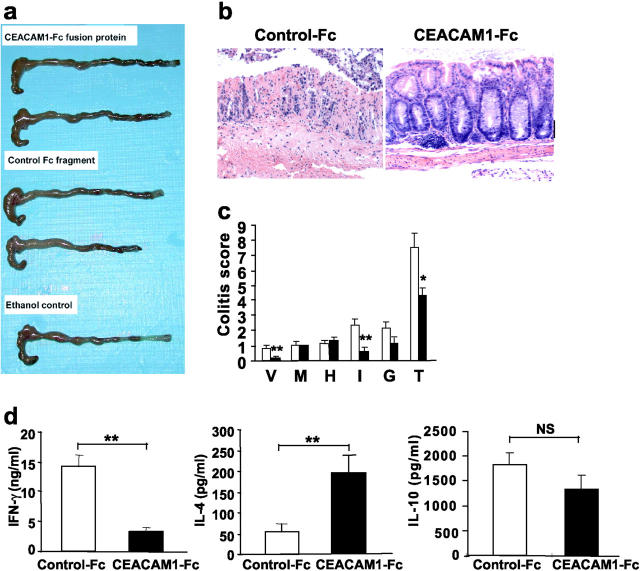
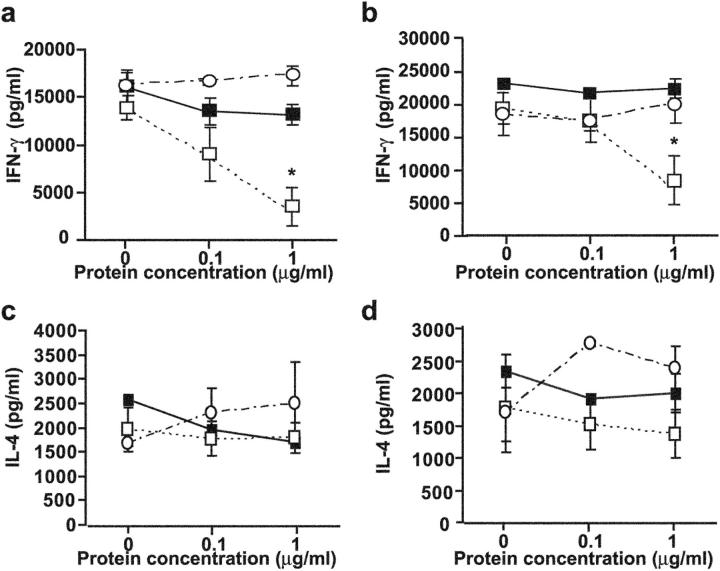
Carcinoembryonic antigen-related cellular adhesion molecule 1 (CEACAM1) is a cell surface molecule that has been proposed to negatively regulate T cell function. We have shown that CEACAM1 is associated with specific regulation of T helper cell (Th)1 pathways, T-bet-mediated Th1 cytokine signaling, and Th1-mediated immunopathology in vivo. Mice treated with anti-mouse CEACAM1-specific monoclonal antibody (mAb) CC1 during the effector phase exhibited a reduced severity of trinitrobenzene sulfonic acid colitis in association with decreased interferon (IFN)-gamma production. Although oxazolone colitis has been reported as Th2 mediated, mice treated with the CC1 mAb or a CEACAM1-Fc chimeric protein exhibited a reduced severity of colitis in association with a significant reduction of IFN-gamma and T-bet activation, whereas signal transducer and activator of antigen 4 activation was unaffected. Both interleukin-4 and IFN-gamma gene-deficient mice exhibited less severe colitis induction by oxazolone. Direct ligation of T cells in vitro with the murine hepatitis virus spike protein, a natural ligand for the N-domain of CEACAM1, inhibited the differentiation of naive cells into Th1 but not Th2 cells and activation of Th1 but not Th2 cytokine production. These results indicate that CEACAM1 isoforms are a novel class of activation-induced cell surface molecules on T cells that function in the specific regulation of Th1-mediated inflammation such as that associated with inflammatory bowel disease.


Figures

Figure 1.
Figure 1.
Effect of CC1 mAb injection on the induction of TNBS colitis and cytokine production. (a) Body weight of mice subjected to TNBS colitis treated either with control IgG1 mAb (□), with CC1 mAb before skin painting and before rectal challenge twice (▪), before skin painting (•), or before rectal challenge (○) in C57BL/6 mice are shown. One group was injected with 50% ethanol (▴) instead of TNBS. Data are shown as mean values ± SEM and represent eight mice per group. (b) Macroscopic pictures of colons from mice induced with TNBS colitis treated with or without CC1 mAb are shown. (c) Hematoxylin and eosin–stained pictures from TNBS colitis treated with or without CC1 mAb are shown (×100). One representative picture from each group of eight is shown. A, control mAb; B, CC1 mAb administered twice; C, CC1 mAb administered before skin painting; D, CC1 mAb administered before rectal challenge. (d) Quantitative histopathologic assessment of TNBS colitis activity shows a significant (*, P < 0.05 by t test) suppression in mice treated with CC1 mAb either twice or before rectal challenge when compared with the control mAb–treated group. Samples were collected from mice with TNBS colitis treated either with control mAb (solid bar) or CC1 mAb twice (open bar) before skin painting (shaded bar) or before rectal challenge (striped bar). Data are shown as mean values ± SEM and represent eight mice per group. (e) Th1 and Th2 cytokine production from LPLs was analyzed by ELISA. Samples were collected from mice with TNBS colitis treated either with control mAb (solid bars) or CC1 mAb twice (open bars) before skin painting (shaded bars) or before rectal challenge (striped bars). One group of mice was administered ethanol without TNBS for the skin sensitization and rectal challenge (hatched bars). CC1 mAb–treated group treated either twice or before rectal challenge exhibited significant suppression of IFN-γ production when compared with the control mAb–treated group (**, P < 0.01). Data are shown as mean values ± SEM and represent pooled values from eight independent experiments.
Figure 2.
Figure 2.
Effect of CC1 mAb injection on the induction of oxazolone colitis and cytokine production. (a) Oxazolone colitis was induced in C57BL/6 mice and mice were monitored for body weight after various combinations of treatments with CC1 or control mAb. Mice were treated either with control IgG1 mAb (□), with CC1 mAb twice (▪), before skin painting (•), or before rectal challenge (○). One group was subjected to intrarectal administration with 50% ethanol (▴) instead of oxazolone. Data are shown as mean values ± SEM and represent eight mice per group. (b) Macroscopic pictures of oxazolone colitis treated with or without CC1 mAb. (c) Histologic hematoxylin and eosin–stained pictures from oxazolone colitis treated with or without CC1 mAb are shown (×100). One representative picture from each group of eight is shown. A, control mAb; B, CC1 mAb administered twice; C, CC1 mAb administered before skin painting; D, CC1 mAb administered before rectal challenge. (d) Quantitative histopathologic assessment of oxazolone colitis activity shows a significant suppression in mice treated with CC1 mAb either twice or before rectal challenge in comparison to the control mAb–treated group (*, P < 0.01). Samples were collected from mice with oxazolone colitis that were treated either with control mAb (solid bar) or CC1 mAb either twice (open bar), before skin painting (shaded bar), or before rectal challenge (striped bar). Data are provided as mean values ± SEM and represent eight mice per group. V, hyper-vascularization; M, presence of mononuclear cells; H, epithelial cell hyperplasia; I, epithelial injury; G, presence of granulocytes; T, total score. (e) Th1 and Th2 cytokine production from LPLs was analyzed by ELISA. Samples were collected from mice with oxazolone colitis that were treated either with control mAb (solid bars) or CC1 mAb either twice (open bars), before skin painting (shaded bars), or before rectal challenge (striped bars). One group of mice was administered ethanol instead of oxazolone (hatched bars). Mice treated with CC1 mAb either twice or before rectal challenge exhibited significant suppression of IFN-γ production when compared with the control mAb–treated group (*, P < 0.01). Data shown represent pooled values from eight independent experiments. Data are shown as mean values ± SEM. (f) Analysis of T-bet and STAT-4 levels in splenic mononuclear cells from mice with oxazolone-induced colitis upon CEACAM1 ligation. Mice with oxazolone-induced colitis were treated with the CC1 mAb as described above followed by isolation of splenic cells and extraction of nuclear proteins. Spleen mononuclear cells were stimulated in a T cell–specific fashion with antibodies to CD3 and CD28 for 24 h. Equal amounts of proteins from two to three mice per group were then subjected to Western blot analysis for expression of STAT-4 and T-bet as indicated. Samples from 1 through 3 were obtained from mice treated with CC1 mAb and samples from 4 and 5 were obtained from mice treated with control mAb. T-bet gave two bands by Western blot analysis as previously described (references and 33).
Figure 3.
Figure 3.
Effect of anti–IL-4 mAb and CC1 mAb injection on the induction of oxazolone colitis. (a) Body weight of mice treated with anti–IL-4 mAb together with CC1 mAb (♦), anti–IL-4 mAb and control mouse IgG1 (□), or control rat IgG and mouse IgG1 (▴). Prevention of body weight loss was significant (*, P < 0.05; **, P < 0.01) in mice administered anti–IL-4 and CC1 mAb when compared with the control Ab–treated group. Data shown are expressed as mean values ± SEM from six mice per group. Representative macroscopic (b) and microscopic (c; ×100) pictures of mice treated with or without anti–IL-4 and CC1 mAbs are shown.
Figure 4.
Figure 4.
Effect of CEACAM1-Fc chimeric protein on the induction of oxazolone colitis. Macroscopic (a) and histologic pictures (b; ×100) of colon isolated from mice induced to develop oxazolone colitis treated with CEACAM1-Fc or a control-Fc fragment. (c) Colitis scores of colon-induced oxazolone colitis treated with CEACAM1-Fc (solid bar) or a control-Fc fragment (open bar). Mice treated with CEACAM1-Fc exhibited significant reduction in colitis scores (*, P < 0.005; **, P < 0.01). V, hyper-vascularization; M, presence of mononuclear cells; H, epithelial cell hyperplasia; I, epithelial injury; G, presence of granulocytes; T, total score. (d) Th1 and Th2 cytokine production from LPLs was analyzed by ELISA of mice with oxazolone colitis treated either with CEACAM1-Fc (solid bars) or control-Fc fragment (open bars). Suppression of IFN-γ was significant (**, P < 0.01). Data are shown as mean values ± SEM from four independent experiments.
Figure 5.
Figure 5.
CEACAM1a-mediated inhibition of T cells. Naive T cells isolated from C57BL/6 mice were stimulated in vitro with anti-CD3 mAb and anti-CD28 mAb under Th1-inducing conditions (a and b) or Th2-inducing (c and d) conditions. Different concentrations of the MHV spike glycoprotein with or without antisera to the anti-MHV spike glycoprotein were added in the culture during (a and c) or after (b and d) the differentiation to Th1/Th2 cells. Production of IFN-γ was significantly suppressed by the spike glycoprotein when added during and after the differentiation to Th1 (*, P < 0.05) but not Th2 cells. ▪, BSA; □, spike protein plus control serum; ○, spike protein plus antisera to spike glycoprotein. Data are shown as mean ± SEM and are representative of three separate experiments.

References

    1. Beauchemin, N., P. Draber, G. Dveksler, P. Gold, S. Gray-Owen, F. Grunert, S. Hammarstrom, K.V. Holmes, A. Karlsson, M. Kuroki, et al. 1999. Redefined nomenclature for members of the carcinoembryonic antigen family. Exp. Cell Res. 252:243–249. - PubMed
    1. Hammarstrom, S. 1999. The carcinoembryonic antigen (CEA) family: structures, suggested functions and expression in normal and malignant tissues. Semin. Cancer Biol. 9:67–81. - PubMed
    1. Kammerer, R., D. Stober, B.B. Singer, B. Obrink, and J. Reimann. 2001. Carcinoembryonic antigen-related cell adhesion molecule 1 on murine dendritic cells is a potent regulator of T cell stimulation. J. Immunol. 166:6537–6544. - PubMed
    1. Moller, M.J., R. Kammerer, F. Grunert, and S. von Kleist. 1996. Biliary glycoprotein (BGP) expression on T cells and on a natural-killer-cell sub-population. Int. J. Cancer. 65:740–745. - PubMed
    1. Chen, T., W. Zimmermann, J. Parker, I. Chen, A. Maeda, and S. Bolland. 2001. Biliary glycoprotein (BGPa, CD66a, CEACAM1) mediates inhibitory signals. J. Leukoc. Biol. 70:335–340. - PubMed

Publication types

MeSH terms