. 2004 Feb 16;164(4):515-26.
doi: 10.1083/jcb.200305142.

Promyelocytic leukemia nuclear bodies associate with transcriptionally active genomic regions

Affiliations

Promyelocytic leukemia nuclear bodies associate with transcriptionally active genomic regions

Jayson Wang et al. J Cell Biol. .

Abstract

The promyelocytic leukemia (PML) protein is aggregated into nuclear bodies that are associated with diverse nuclear processes. Here, we report that the distance between a locus and its nearest PML body correlates with the transcriptional activity and gene density around the locus. Genes on the active X chromosome are more significantly associated with PML bodies than their silenced homologues on the inactive X chromosome. We also found that a histone-encoding gene cluster, which is transcribed only in S-phase, is more strongly associated with PML bodies in S-phase than in G0/G1 phase of the cell cycle. However, visualization of specific RNA transcripts for several genes showed that PML bodies were not themselves sites of transcription for these genes. Furthermore, knock-down of PML bodies by RNA interference did not preferentially change the expression of genes closely associated with PML bodies. We propose that PML bodies form in nuclear compartments of high transcriptional activity, but they do not directly regulate transcription of genes in these compartments.


Figures

Figure 1.
Figure 1.
Mapped locations of loci analyzed for association with PML bodies. Loci found to be more significantly associated with PML bodies than the TAP/LMP locus are shown in red. Loci that are as associated as the TAP/LMP locus are shown in green. Loci that are less significantly associated are shown in black. For the X chromosome, loci on the active and inactive homologues were compared. Loci that were more significantly associated with PML bodies on the active than the inactive chromosome are shown in orange. Loci that are equally associated with PML bodies on both X chromosomes are shown in blue.
Figure 2.
Figure 2.
Comparison of locus–PML associations for genes on chromosomes 1 and 9 in relation to the local transcription activity, local gene density, and individual gene transcription. Local transcription activity was calculated for ± 1 centiRay around each locus, local gene density was calculated for ± 500 kb around each locus, and individual gene activity was determined relative to transcription of the β-actin gene. Locus–PML association is represented by mmd-locus in micrometers, with error bars showing 1 standard error.
Figure 3.
Figure 3.
Linear regression graphs comparing locus–PML association with different parameters. A and B show the the local transcriptional activity, C shows individual gene transcription, and D shows the local gene density. For B, centromeric and outlying loci were excluded. The locus–PML association is represented by mmd-locus in micrometers. The local transcription activity, local gene density, and individual gene transcription are calculated as in Fig. 2. Each bullet represents a locus. Each graph displays the best line fit for the regression.
Figure 4.
Figure 4.
Association of PML bodies with loci on the active and inactive X chromosomes. (A) WI-38 fibroblast cell nucleus showing the PSMD10 gene (green) on the X chromosome, PML bodies (blue), and propidium iodide counterstain (red). The inactive copy of the gene is distinguished by the Barr body (arrow). Bar, 5 μm. (B) Comparison of the locus–PML distances for loci along active and inactive X chromosomes. The locus–PML association is represented as the mmd-locus distances for the active and inactive copy of each locus, with error bars showing 1 standard error. Results for loci in and out of the pseudoautosomal regions are pooled and displayed at the top and bottom of the figure, respectively.
Figure 5.
Figure 5.
Association of PML bodies with loci along chromosome 6, in cells in S-phase compared with cells in G0/G1 phase. (A and B) MRC5 cell nuclei showing the histone gene cluster (red) at 6p22, PML bodies (blue), and incorporated BrdU (green) [A, cell in non-S (G0/G1) phase; B, cell in S-phase]. Bar, 5 μm. (C) Locus–PML distances for different loci were compared between cells in S-phase versus G0/G1 phase. “(mmd-locus) − (mmd-PML)” on the x axis represents the distance to which a locus is further from or closer to the nearest PML body compared with the PML–PML distance, with error bars showing 1.4 standard errors. t tests were performed between the cells of G0/G1 and S-phases for the four loci. Only the histone cluster on 6p22 shows a significant difference in gene-PML association between cells in S- versus G0/G1 phase.
Figure 6.
Figure 6.
The effect of knock-down and formation of new PML bodies on transcription levels. (A and B) MRC5 cells showing typical PML body distribution in normal (A) and PML siRNA-treated (B) cells. (C) Immunoblot assay for PML and β-actin (ACTB) proteins from cell lysates in PML RNAi-treated MRC5 cells (a), nonsilencing RNAi-treated cells (b), and untreated cells (c). The PML protein in sample a was quantified by analysis software to be 40% of the intensity compared with sample b, and 55% compared with sample c. The β-actin protein in sample a was 97% compared with sample b, and 98% compared with sample c. (D) Graph showing the change in transcription levels of genes in cells treated with PML RNAi, measured by real-time PCR, as compared with cells treated with nonsilencing siRNA. Loci studied were arranged in increasing mmd-locus values. The vertical axis represents the ratio of transcription level of a gene in RNAi-treated cells to that of the control group (= 1), on a log2 scale. Therefore, a change above the line means an increase in expression of a gene, whereas a change below the line means a decrease in expression, compared with the control group. (E and F) NB4 cells showing the microspeckled pattern of PML protein (red) before ATRA treatment (E), and the formation of PML bodies (blue) after differentiation (F). F also shows four TAP/LMP loci (green) and 6p24 loci (red) in the treated cells (NB4 cells have a hypotetraploid karyotype). (G) A graph showing the change in transcription levels by real-time PCR of genes in NB4 cells after treatment with ATRA, compared with untreated cells. Horizontal and vertical axes are scaled as in D. Bars, 5 μm.
Figure 7.
Figure 7.
Association of RNA-FISH signals with PML bodies for the TAP/LMP, HSPA5, and COL1A1 loci. (A–C) MRC5 cells showing the RNA transcript signals (green), corresponding genomic loci (red), and PML bodies (blue) for the TAP/LMP (A), HSPA5 (B), and COL1A1 (C) loci. The TAP/LMP locus comprises the genes LMP2, LMP7, TAP1, and TAP2. (D) The proportion of RNA signals (in cells with detectable signals) that were in direct contact with a PML body for the three loci, compared with those not in direct contact. RNA signals tended to be larger than the corresponding DNA signals, suggesting the spreading of RNA transcripts from the gene location. RNA loci were considered in contact with a PML body if any part of the detectable signal was visually seen to be in contact. The percentages of RNA signals in contact with PML bodies were 68% (TAP/LMP), 68% (HSPA5), and 65% (COL1A1). For the same loci (with detectable RNA signals), the percentages of DNA signals in contact with PML bodies (which may reflect the site of transcription; not depicted) were 52% (TMP/LMP), 70% (HSPA5), and 39% (COL1A1). These scores were not directly comparable to the corresponding scores in Table S1 (available at http://www.jcb.org/cgi/content/full/jcb.200305142/DC1) because for TAP/LMP and HSPA5, cells were treated such that the number of PML bodies were increased. Bars, 5 μm.
Figure 8.
Figure 8.
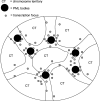
Proposed model of PML body function and position in the nucleus. PML bodies aggregate at regions of highest density/levels of transcription activity. Transcribed genes that are in regions with low overall transcription activity are less likely to associate with PML bodies.

Similar articles

Cited by

References

    1. Artavanis-Tsakonas, S., K. Matsuno, and M.E. Fortini. 1995. Notch signaling. Science. 268:225–232. - PubMed
    1. Bischof, O., S.H. Kim, J. Irving, S. Beresten, N.A. Ellis, and J. Campisi. 2001. Regulation and localization of the Bloom syndrome protein in response to DNA damage. J. Cell Biol. 153:367–380. - PMC - PubMed
    1. Bloch, D.B., J.D. Chiche, D. Orth, S.M. de la Monte, A. Rosenzweig, and K.D. Bloch. 1999. Structural and functional heterogeneity of nuclear bodies. Mol. Cell. Biol. 19:4423–4430. - PMC - PubMed
    1. Boehm, U., T. Klamp, M. Groot, and J.C. Howard. 1997. Cellular responses to interferon-γ. Annu. Rev. Immunol. 15:749–795. - PubMed
    1. Boisvert, F.M., M.J. Hendzel, and D.P. Bazett-Jones. 2000. Promyelocytic leukemia (PML) nuclear bodies are protein structures that do not accumulate RNA. J. Cell Biol. 148:283–292. - PMC - PubMed

Publication types

MeSH terms

Substances