. 2004 Feb 16;164(4):547-56.
doi: 10.1083/jcb.200310046.

Mutagenesis of the putative sterol-sensing domain of yeast Niemann Pick C-related protein reveals a primordial role in subcellular sphingolipid distribution

Affiliations

Mutagenesis of the putative sterol-sensing domain of yeast Niemann Pick C-related protein reveals a primordial role in subcellular sphingolipid distribution

Krishnamurthy Malathi et al. J Cell Biol. .

Abstract

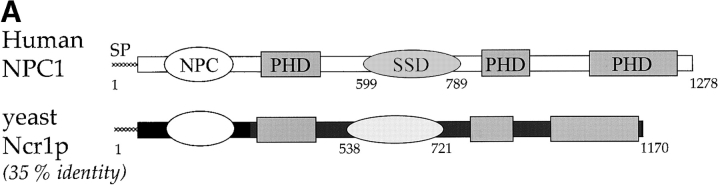
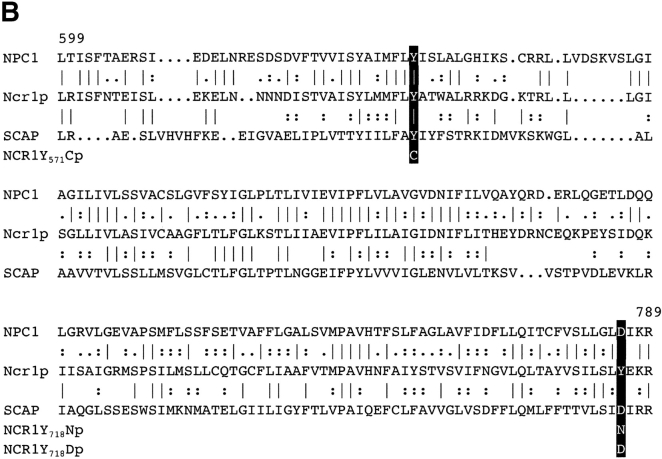
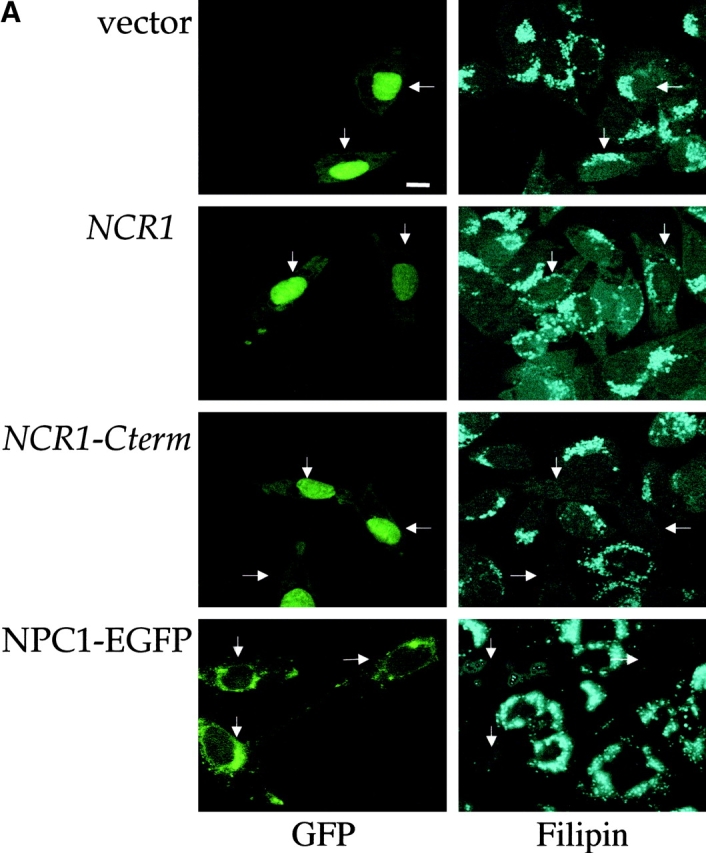
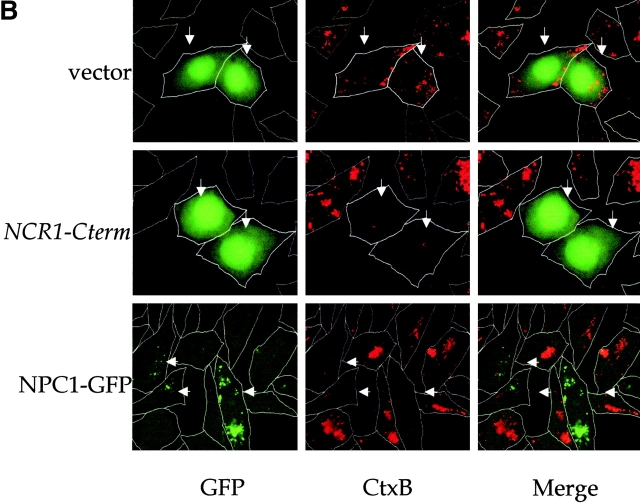
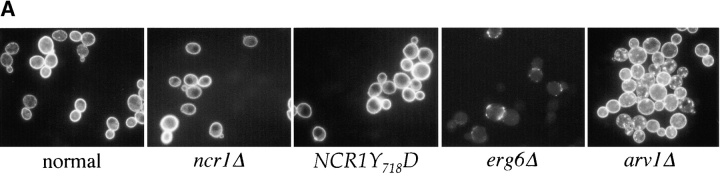
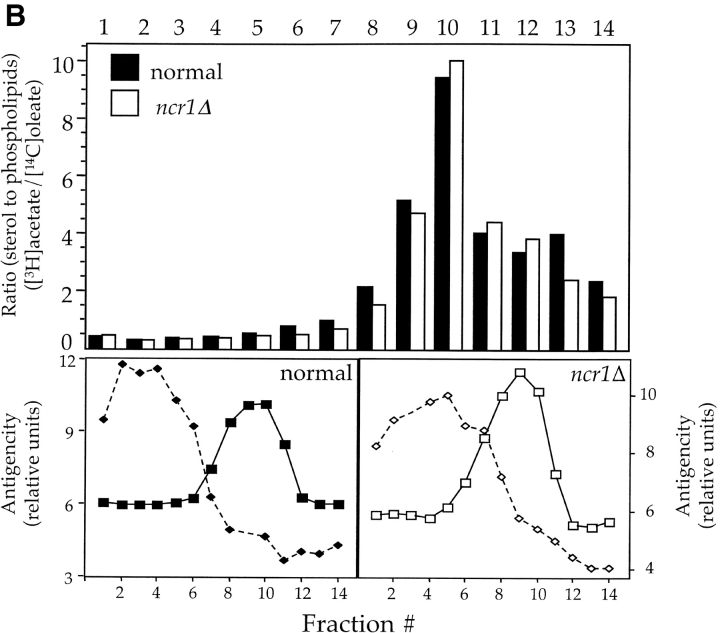
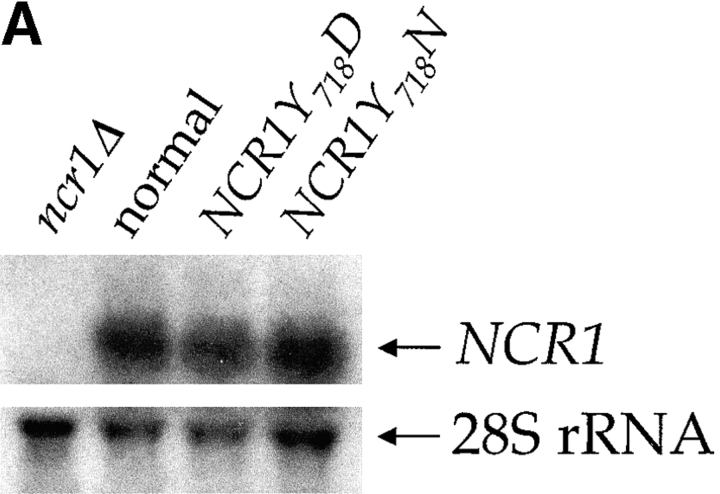
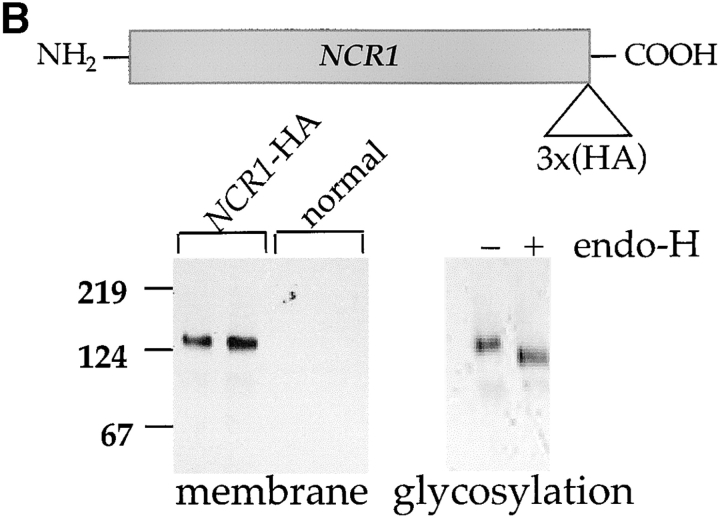
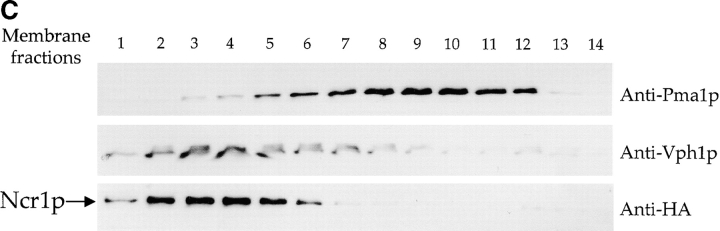
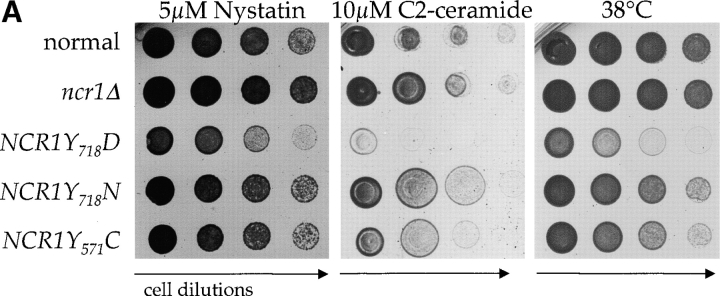
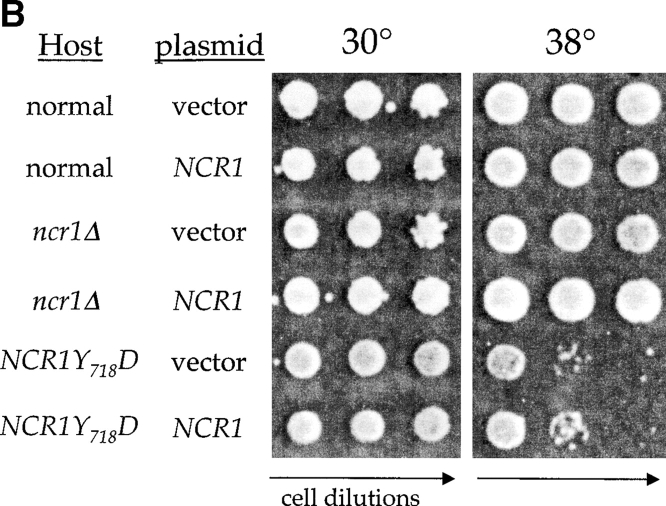
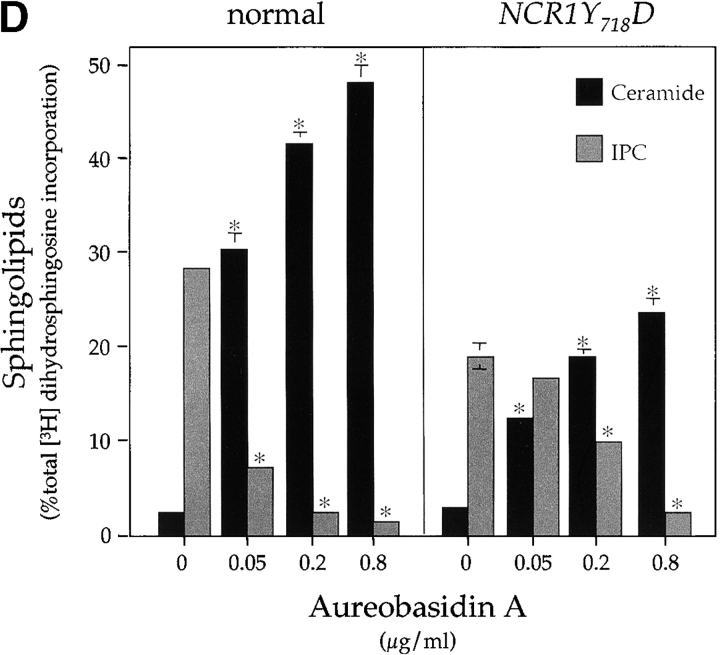
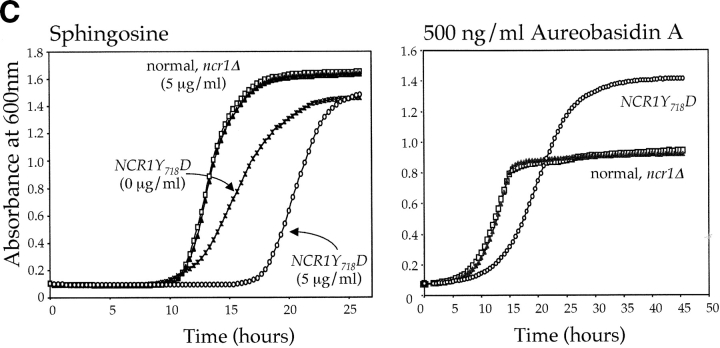
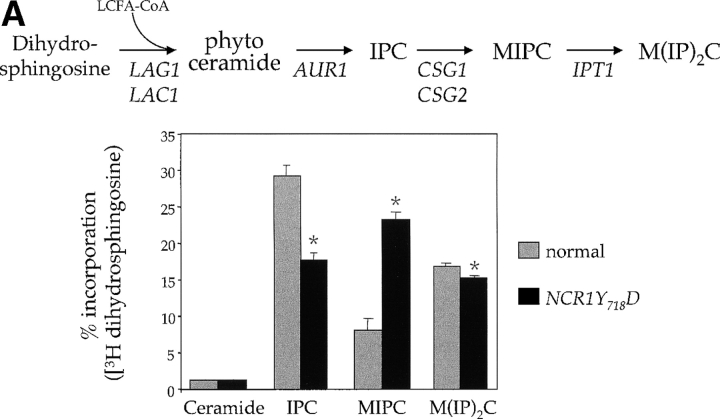
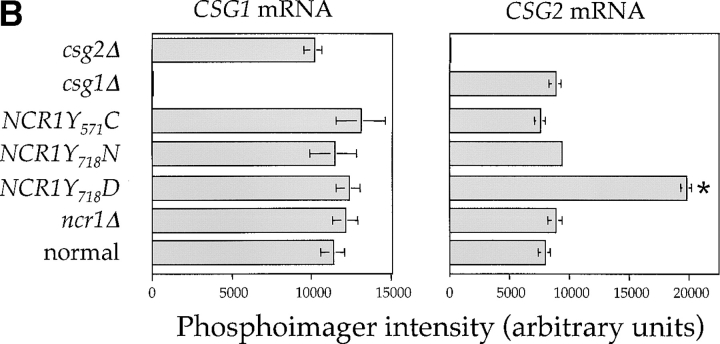
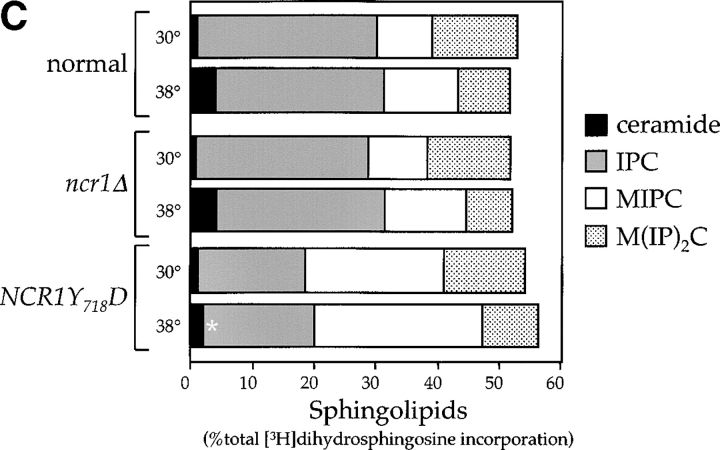
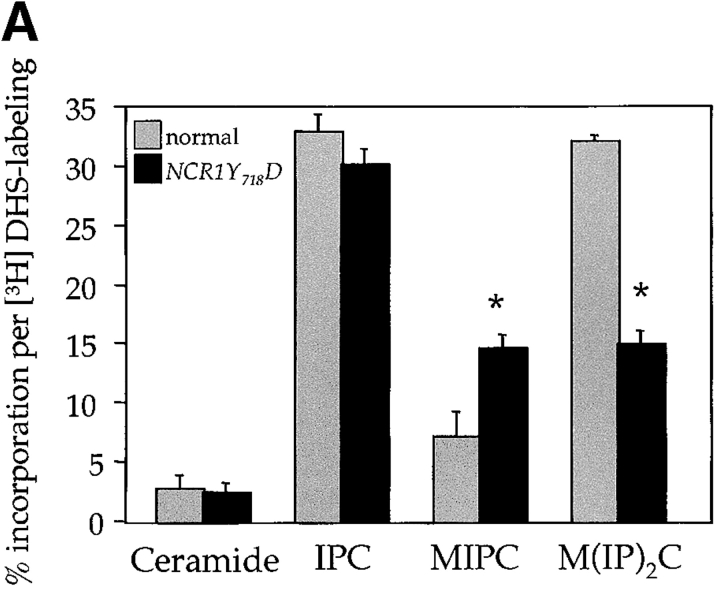
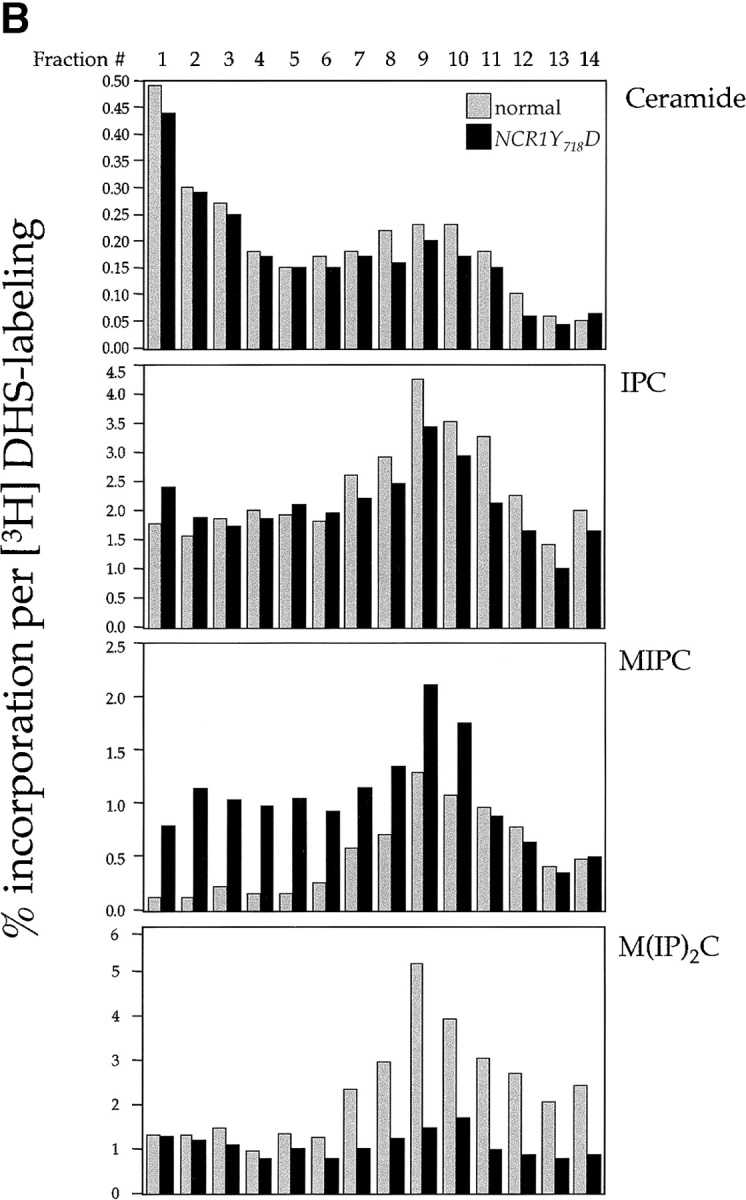
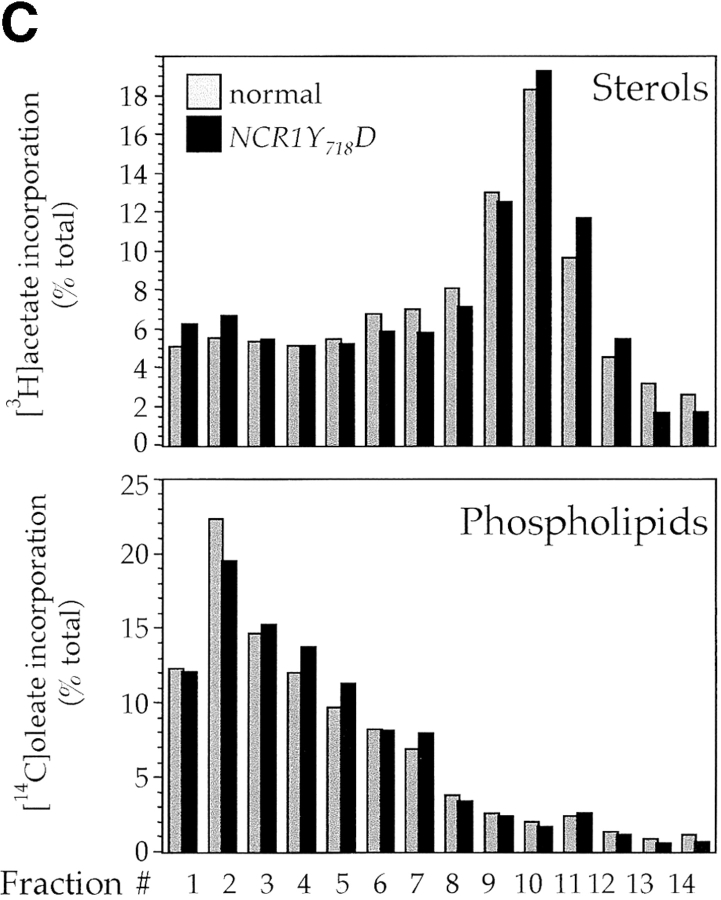
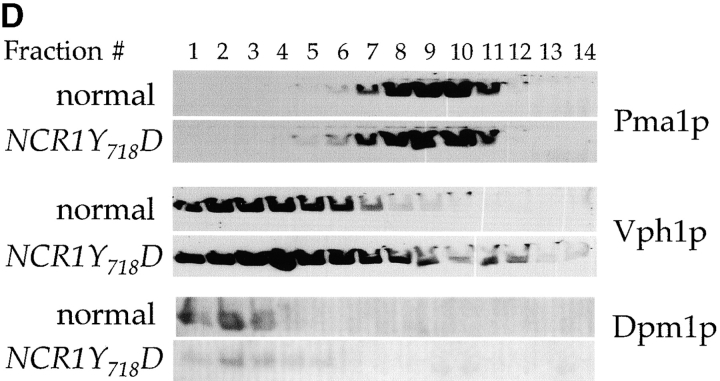
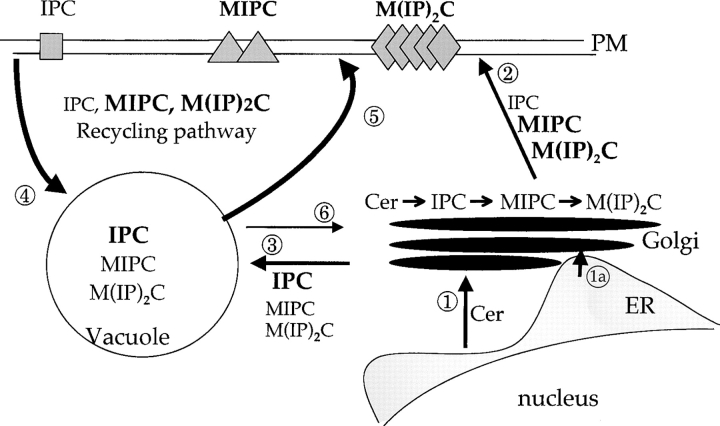
Lipid movement between organelles is a critical component of eukaryotic membrane homeostasis. Niemann Pick type C (NP-C) disease is a fatal neurodegenerative disorder typified by lysosomal accumulation of cholesterol and sphingolipids. Expression of yeast NP-C-related gene 1 (NCR1), the orthologue of the human NP-C gene 1 (NPC1) defective in the disease, in Chinese hamster ovary NPC1 mutant cells suppressed lipid accumulation. Deletion of NCR1, encoding a transmembrane glycoprotein predominantly residing in the vacuole of normal yeast, gave no phenotype. However, a dominant mutation in the putative sterol-sensing domain of Ncr1p conferred temperature and polyene antibiotic sensitivity without changes in sterol metabolism. Instead, the mutant cells were resistant to inhibitors of sphingolipid biosynthesis and super sensitive to sphingosine and C2-ceramide. Moreover, plasma membrane sphingolipids accumulated and redistributed to the vacuole and other subcellular membranes of the mutant cells. We propose that the primordial function of these proteins is to recycle sphingolipids and that defects in this process in higher eukaryotes secondarily result in cholesterol accumulation.


Figures

Figure 1.
Figure 1.
Sequence comparisons of human Npc1 and yeast Ncr1p. (A) Conserved domains in NPC1 and Ncr1p. In addition to the NPC domain that distinguishes the NPC1 gene family, Ncr1p retains a putative sterol-sensing domain (SSD) and several regions of similarity to the morphogen receptor, Patched (Patched homology domain, PHD). (B) The putative SSD of NPC1, Ncr1p, and SCAP. Residues 599–789 of human NPC1, 538–721 of yeast Ncr1p, and 264–444 of human SCAP are aligned. Sequence identity is indicated by the vertical bar and similarity by colons and periods. Across this region the NPC1 and Ncr1p sequences are 43% identical. The NCR1Y 571C, NCR1Y 718D, and NCR1Y 718N variants are indicated.
Figure 1.
Figure 1.
Sequence comparisons of human Npc1 and yeast Ncr1p. (A) Conserved domains in NPC1 and Ncr1p. In addition to the NPC domain that distinguishes the NPC1 gene family, Ncr1p retains a putative sterol-sensing domain (SSD) and several regions of similarity to the morphogen receptor, Patched (Patched homology domain, PHD). (B) The putative SSD of NPC1, Ncr1p, and SCAP. Residues 599–789 of human NPC1, 538–721 of yeast Ncr1p, and 264–444 of human SCAP are aligned. Sequence identity is indicated by the vertical bar and similarity by colons and periods. Across this region the NPC1 and Ncr1p sequences are 43% identical. The NCR1Y 571C, NCR1Y 718D, and NCR1Y 718N variants are indicated.
Figure 2.
Figure 2.
Expression of yeast NCR1 restores lipid trafficking in NPC1 mutant mammalian cells. CHO cell line CT60 was transiently transfected with a human NPC1–EGFP fusion or cotransfected with pEGFP and pCR3.1 (vector), pCR3.1-NCR1 (NCR1), or pCR3.1–NCR1-Cterm (NCR1-Cterm). The arrows indicate transfected cells based on fluorescence conferred by the pEGFP vector or the NPC1–EGFP fusion. Representative images are shown. (A) Cells were preincubated with LDLs and stained for cholesterol with filipin and imaged for GFPs. (B) Transfected cells were stained with fluorescent subunit B of cholera toxin (CTx-B) to detect the ganglioside GM1 and imaged for GFPs.
Figure 2.
Figure 2.
Expression of yeast NCR1 restores lipid trafficking in NPC1 mutant mammalian cells. CHO cell line CT60 was transiently transfected with a human NPC1–EGFP fusion or cotransfected with pEGFP and pCR3.1 (vector), pCR3.1-NCR1 (NCR1), or pCR3.1–NCR1-Cterm (NCR1-Cterm). The arrows indicate transfected cells based on fluorescence conferred by the pEGFP vector or the NPC1–EGFP fusion. Representative images are shown. (A) Cells were preincubated with LDLs and stained for cholesterol with filipin and imaged for GFPs. (B) Transfected cells were stained with fluorescent subunit B of cholera toxin (CTx-B) to detect the ganglioside GM1 and imaged for GFPs.
Figure 3.
Figure 3.
Sterol distribution in yeast NCR1 mutants. (A) Yeast strains (normal, ncr1Δ, and NCR1Y 718D) were stained with filipin to detect ergosterol. Deletions in ERG6 (erg6Δ) block synthesis of ergosterol, whereas ARV1 deletions (arv1Δ) accumulate sterol in subcellular membranes. (B) Cell membrane preparations from normal and NCR1 deletion strains were subjected to subcellular fractionation, lipid extraction, and TLC analysis after [14C]oleate or [3H]acetate incorporation. Distributions of sterols relative to phospholipid are given as a ratio of [3H]acetate to [14C]oleate. Total [3H]acetate and [14C]oleate incorporation was 3.06 and 1.79 (normal) versus 2.77 and 1.18 (deletion) × 105 dpm/OD600, respectively. Fractions were characterized by immunoblotting with antisera to the plasma membrane ATPase (Pma1p, solid line, squares) and the vacuolar membrane H+-ATPase (Vph1p, dashed line, diamonds), followed by scanning densitometry (arbitrary units, representative data).
Figure 3.
Figure 3.
Sterol distribution in yeast NCR1 mutants. (A) Yeast strains (normal, ncr1Δ, and NCR1Y 718D) were stained with filipin to detect ergosterol. Deletions in ERG6 (erg6Δ) block synthesis of ergosterol, whereas ARV1 deletions (arv1Δ) accumulate sterol in subcellular membranes. (B) Cell membrane preparations from normal and NCR1 deletion strains were subjected to subcellular fractionation, lipid extraction, and TLC analysis after [14C]oleate or [3H]acetate incorporation. Distributions of sterols relative to phospholipid are given as a ratio of [3H]acetate to [14C]oleate. Total [3H]acetate and [14C]oleate incorporation was 3.06 and 1.79 (normal) versus 2.77 and 1.18 (deletion) × 105 dpm/OD600, respectively. Fractions were characterized by immunoblotting with antisera to the plasma membrane ATPase (Pma1p, solid line, squares) and the vacuolar membrane H+-ATPase (Vph1p, dashed line, diamonds), followed by scanning densitometry (arbitrary units, representative data).
Figure 4.
Figure 4.
NCR1 expression in yeast. (A) RNA hybridization of the indicated strains grown in YPD media at 30°C. The loading control of 28S ribosomal RNA is shown. No significant differences in NCR1 transcript levels for normal, NCR1Y 718D, NCR1Y 718N, or NCR1Y 571C (not depicted) strains were detected. (B) Expression of Ncr1-HAp. The chromosomal copy of NCR1 was tagged with HA at the COOH terminus by homologous recombination. Duplicate membrane extracts were solubilized with Triton X-100, deglycosylated (endo-H), and resolved by SDS-PAGE and immunoblotting (αHA 12CA5 mAb). Molecular mass markers (Bio-Rad Laboratories) are shown. (C) Subcellular localization of Ncr1-HAp. Membrane preparations from cells expressing Ncr1-HA were fractionated by ultracentrifugation in Renograffin 60. Fractions 1–14 were characterized by SDS-PAGE and immunoblotting with antibodies to Ncr1-HA (Anti-HA), the plasma membrane ATPase (Anti-Pma1p), and the vacuolar H+-ATPase (Anti-Vph1p).
Figure 4.
Figure 4.
NCR1 expression in yeast. (A) RNA hybridization of the indicated strains grown in YPD media at 30°C. The loading control of 28S ribosomal RNA is shown. No significant differences in NCR1 transcript levels for normal, NCR1Y 718D, NCR1Y 718N, or NCR1Y 571C (not depicted) strains were detected. (B) Expression of Ncr1-HAp. The chromosomal copy of NCR1 was tagged with HA at the COOH terminus by homologous recombination. Duplicate membrane extracts were solubilized with Triton X-100, deglycosylated (endo-H), and resolved by SDS-PAGE and immunoblotting (αHA 12CA5 mAb). Molecular mass markers (Bio-Rad Laboratories) are shown. (C) Subcellular localization of Ncr1-HAp. Membrane preparations from cells expressing Ncr1-HA were fractionated by ultracentrifugation in Renograffin 60. Fractions 1–14 were characterized by SDS-PAGE and immunoblotting with antibodies to Ncr1-HA (Anti-HA), the plasma membrane ATPase (Anti-Pma1p), and the vacuolar H+-ATPase (Anti-Vph1p).
Figure 5.
Figure 5.
Sphingolipid phenotypes in NCR1 mutants. (A) Fivefold dilutions of strains of the indicated genotypes were plated to the media shown and incubated at 30 or 38°C. (B) Haploid yeast of the indicated genotype were transformed with control or NCR1 expression plasmids, serially diluted, and plated at 30 and 38°C. (C) Growth of strains of the indicated genotypes in response to sphingosine or ABA were derived by continuous analysis of culture absorbance (600 nm). (D) Synthesis of ceramide and IPC after metabolic incorporation of [3H]DHS (2 h) in the presence of ABA. Sphingolipids were extracted and analyzed by TLC and radio-image scanning. The percent total incorporation into all lipids are shown. Means ± SEM; *, P < 0.01, relative to previous concentration of ABA. Absence of error bars indicates too small for scale.
Figure 5.
Figure 5.
Sphingolipid phenotypes in NCR1 mutants. (A) Fivefold dilutions of strains of the indicated genotypes were plated to the media shown and incubated at 30 or 38°C. (B) Haploid yeast of the indicated genotype were transformed with control or NCR1 expression plasmids, serially diluted, and plated at 30 and 38°C. (C) Growth of strains of the indicated genotypes in response to sphingosine or ABA were derived by continuous analysis of culture absorbance (600 nm). (D) Synthesis of ceramide and IPC after metabolic incorporation of [3H]DHS (2 h) in the presence of ABA. Sphingolipids were extracted and analyzed by TLC and radio-image scanning. The percent total incorporation into all lipids are shown. Means ± SEM; *, P < 0.01, relative to previous concentration of ABA. Absence of error bars indicates too small for scale.
Figure 6.
Figure 6.
Sphingolipid metabolism in NCR1 mutants. (A) The sphingolipid biosynthetic pathway and the metabolism of [3H]DHS in normal and NCR1Y 718D cells. Genes for the biosynthesis of ceramide, IPC, MIPC, and M(IP)2C are indicated. Long-chain fatty acylCoA (LCFA-CoA) is an essential substrate for the synthesis of ceramide. Sphingolipids were extracted from the indicated strains grown in the presence of [3H]DHS for 2 h and analyzed by TLC and radio-image scanning. The percent incorporation into all lipids are shown for sphingolipids. Means ± SEM; *, P < 0.01, relative to normal cells. Total incorporation of [3H]DHS for normal and NCR1Y 718D strains was 1.43 and 1.32 × 10⁶ cpm/mg dry weight, respectively. (B) Quantification of RNA hybridization analysis for genes determining the synthesis of MIPC (CSG1 and CSG2). RNA was extracted, resolved, transferred to nitrocellulose membranes by conventional methods, hybridized with CSG1 or CSG2 probes, and analyzed using a phosphorimager (arbitrary units, means ± SEM). Deletion strains csg1Δ and csg2Δ, respectively, for CSG1 and CSG2 acted as hybridization controls. Actin message levels were comparable between strains (not depicted). (C) The stress induction of ceramide synthesis in NCR1 mutants. Cultures of the indicated genotype were grown to exponential phase, split, and grown for a further 2 h in the presence of [3H]DHS at 30 or 38°C. Incorporation of label was normalized to total incorporation into all lipids, which was equivalent at both temperatures (e.g., for normal strains, 2.53 and 2.19 × 10⁶, cpm at 30 and 38°C, respectively). *, P < 0.01.
Figure 6.
Figure 6.
Sphingolipid metabolism in NCR1 mutants. (A) The sphingolipid biosynthetic pathway and the metabolism of [3H]DHS in normal and NCR1Y 718D cells. Genes for the biosynthesis of ceramide, IPC, MIPC, and M(IP)2C are indicated. Long-chain fatty acylCoA (LCFA-CoA) is an essential substrate for the synthesis of ceramide. Sphingolipids were extracted from the indicated strains grown in the presence of [3H]DHS for 2 h and analyzed by TLC and radio-image scanning. The percent incorporation into all lipids are shown for sphingolipids. Means ± SEM; *, P < 0.01, relative to normal cells. Total incorporation of [3H]DHS for normal and NCR1Y 718D strains was 1.43 and 1.32 × 10⁶ cpm/mg dry weight, respectively. (B) Quantification of RNA hybridization analysis for genes determining the synthesis of MIPC (CSG1 and CSG2). RNA was extracted, resolved, transferred to nitrocellulose membranes by conventional methods, hybridized with CSG1 or CSG2 probes, and analyzed using a phosphorimager (arbitrary units, means ± SEM). Deletion strains csg1Δ and csg2Δ, respectively, for CSG1 and CSG2 acted as hybridization controls. Actin message levels were comparable between strains (not depicted). (C) The stress induction of ceramide synthesis in NCR1 mutants. Cultures of the indicated genotype were grown to exponential phase, split, and grown for a further 2 h in the presence of [3H]DHS at 30 or 38°C. Incorporation of label was normalized to total incorporation into all lipids, which was equivalent at both temperatures (e.g., for normal strains, 2.53 and 2.19 × 10⁶, cpm at 30 and 38°C, respectively). *, P < 0.01.
Figure 7.
Figure 7.
Subcellular distribution of lipids in NCR1 mutants. Lipid levels were assessed after metabolic labeling to steady state with [3H]DHS (sphingolipids), [14C]oleate (phospholipids), or [3H]acetate (sterols) at 30°C for 18 h. (A) Total cellular incorporation into sphingolipid pools (percentage of total extraction, means ± SEM; *, P < 0.01 relative to normal). Total incorporation of [3H]DHS for normal and NCR1Y 718D strains was 1.826 and 2.152 × 10⁵ cpm per OD600, respectively. (B) Cell membrane preparations of identical cultures to those in A were subjected to subcellular fractionation after [3H]DHS incorporation. The distributions of IPC, MIPC, and M(IP)2C are presented as the percentage of total incorporation in normal (gray bars) and NCR1Y 718D (black bars) strains (representative data). (C) Membrane preparations after [14C]oleate or [3H]acetate incorporation were subjected to subcellular fractionation. Total [3H]acetate and [14C]oleate incorporation was 3.06 and 1.79 (normal) versus 6.09 and 2.43 (NCR1Y 718D) × 105 dpm/OD600, respectively. The distributions of sterol and phospholipids are presented as the percentage of total incorporation in normal (gray bars) and NCR1Y 718D (black bars) cells per fraction. (D) Immunoblotting of fractions with antibodies to plasma membrane (Pma1p), dolichol phosphate mannose synthase (Dpm1p, ER), and vacuoles (Vph1). Peak fractions for these markers were coincident between the strains, despite apparent differences in protein expression.
Figure 7.
Figure 7.
Subcellular distribution of lipids in NCR1 mutants. Lipid levels were assessed after metabolic labeling to steady state with [3H]DHS (sphingolipids), [14C]oleate (phospholipids), or [3H]acetate (sterols) at 30°C for 18 h. (A) Total cellular incorporation into sphingolipid pools (percentage of total extraction, means ± SEM; *, P < 0.01 relative to normal). Total incorporation of [3H]DHS for normal and NCR1Y 718D strains was 1.826 and 2.152 × 10⁵ cpm per OD600, respectively. (B) Cell membrane preparations of identical cultures to those in A were subjected to subcellular fractionation after [3H]DHS incorporation. The distributions of IPC, MIPC, and M(IP)2C are presented as the percentage of total incorporation in normal (gray bars) and NCR1Y 718D (black bars) strains (representative data). (C) Membrane preparations after [14C]oleate or [3H]acetate incorporation were subjected to subcellular fractionation. Total [3H]acetate and [14C]oleate incorporation was 3.06 and 1.79 (normal) versus 6.09 and 2.43 (NCR1Y 718D) × 105 dpm/OD600, respectively. The distributions of sterol and phospholipids are presented as the percentage of total incorporation in normal (gray bars) and NCR1Y 718D (black bars) cells per fraction. (D) Immunoblotting of fractions with antibodies to plasma membrane (Pma1p), dolichol phosphate mannose synthase (Dpm1p, ER), and vacuoles (Vph1). Peak fractions for these markers were coincident between the strains, despite apparent differences in protein expression.
Figure 8.
Figure 8.
Pathways of subcellular sphingolipid transport in yeast. Ceramide is synthesized in the ER and transported by vesicular-dependent (1) and -independent (1a) pathways to the Golgi compartment. Conversion to complex sphingolipids (IPC, MIPC, and M(IP)2C) is followed by migration from the Golgi apparatus to the plasma membrane (2) or to vacuoles (3). In the sphingolipid recycling pathway, transport from the plasma membrane to vacuoles (4), or from vacuoles to the plasma membrane or the Golgi compartment (5 or 6), is selective between sphingolipids. Thus, in normal yeast, IPC accumulates in vacuoles, whereas M(IP)2C and to a lesser extent MIPC accumulate in the plasma membrane. In NCR1Y 718D strains, recycling is disturbed such that MIPC and M(IP)2C accumulate in the vacuole. The sequestration of MIPC results in diminished M(IP)2C synthesis and up-regulation of biosynthesis of MIPC from IPC.

Similar articles

Cited by

References

    1. Altschul, S.F., T.L. Madden, A.A. Schaffer, J. Zhang, Z. Zhang, W. Miller, and D.J. Lipman. 1997. Gapped BLAST and PSI-BLAST: a new generation of protein database search programs. Nucleic Acids Res. 25:3389–3402. - PMC - PubMed
    1. Ausubel, F.M., R. Brent, R.E. Kingston, D.D. Moore, J.G. Seidman, J.A. Smith, and K. Struhl. 1998. Saccharomyces cerevisiae. Current Protocols in Molecular Biology. John Wiley & Sons Inc., New York. 13.0.1–13.13.9.
    1. Bagnat, M., S. Keranen, A. Shevchenko, and K. Simons. 2000. Lipid rafts function in biosynthetic delivery of proteins to the cell surface in yeast. Proc. Natl. Acad. Sci. USA. 97:3254–3259. - PMC - PubMed
    1. Bergstrom, J.D., M.M. Kurtz, D.J. Rew, A.M. Amend, J.D. Karkas, R.G. Bostedor, V.S. Bansal, C. Dufresne, F.L. VanMiddlesworth, O.D. Hensens, et al. 1993. Zaragozic acids: a family of fungal metabolites that are picomolar competitive inhibitors of squalene synthase. Proc. Natl. Acad. Sci. USA. 90:80–84. - PMC - PubMed
    1. Carstea, E.D., J.A. Morris, K.G. Coleman, S.K. Loftus, D. Zhang, C. Cummings, J. Gu, M.A. Rosenfeld, W.J. Pavan, D.B. Krizman, et al. 1997. Niemann-Pick C1 disease gene: homology to mediators of cholesterol homeostasis. Science. 277:228–231. - PubMed

Publication types

MeSH terms