. 2004 Mar 2;101(9):2776-81.
doi: 10.1073/pnas.0400122101. Epub 2004 Feb 17.

Glutamate-183 in the conserved TGES motif of domain A of sarcoplasmic reticulum Ca2+-ATPase assists in catalysis of E2/E2P partial reactions

Affiliations

Glutamate-183 in the conserved TGES motif of domain A of sarcoplasmic reticulum Ca2+-ATPase assists in catalysis of E2/E2P partial reactions

Johannes D Clausen et al. Proc Natl Acad Sci U S A. .

Abstract

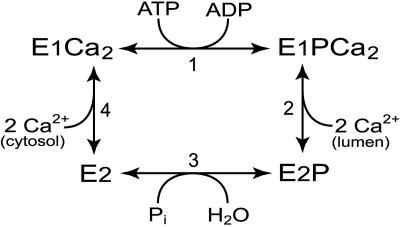
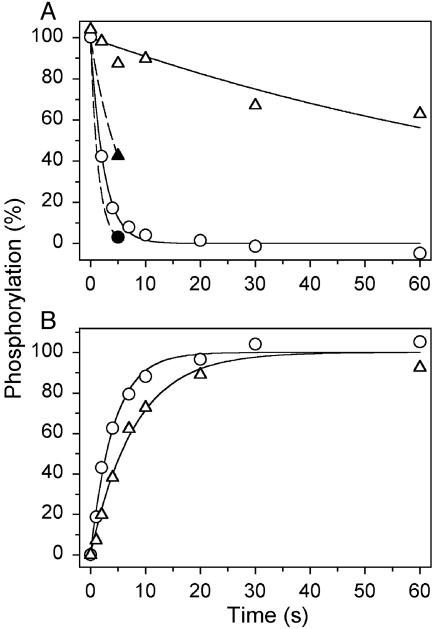
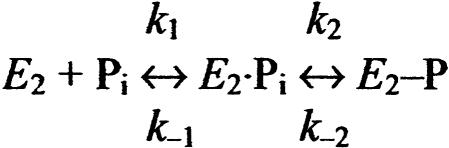
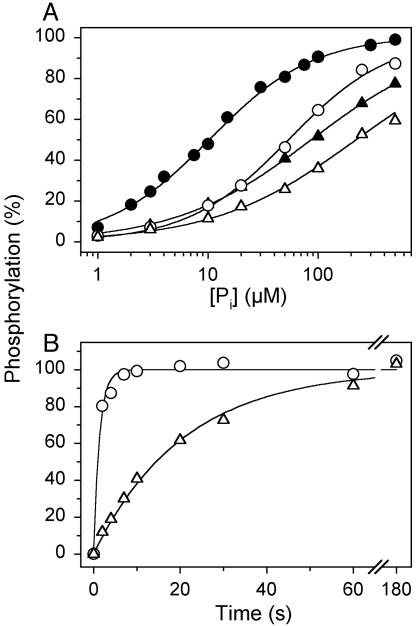
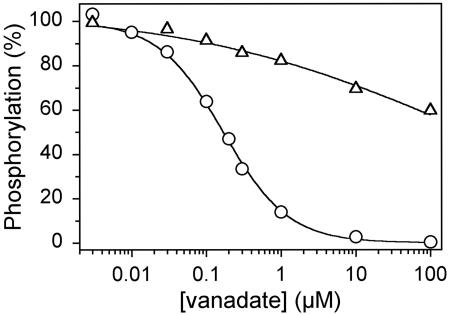
The recently determined crystal structures of the sarcoplasmic reticulum Ca(2+)-ATPase show that in the E(1)Ca(2) form, domain A is almost isolated from the other cytoplasmic domains, P and N, whereas in E(2), domain A has approached domains P and N, with E183 of the highly conserved P-type ATPase signature sequence TGES in domain A now being close to the phosphorylated aspartate in domain P, thus raising the question whether E183 acquires a catalytic role in E(2) and E(2)P conformations. This study compares the partial reactions of mutant E183A and wild-type Ca(2+)-ATPase, using transient and steady-state kinetic measurements. It is demonstrated that dephosphorylation of the E(2)P phosphoenzyme intermediate, as well as reverse phosphorylation of E(2) with P(i), is severely inhibited in the mutant. Furthermore, the apparent affinity of E(2) for the phosphoryl transition state analog vanadate is reduced by three orders of magnitude, consistent with a destabilization of the transition state complex, and the mutant displays reduced apparent affinity for P(i) in the E(2) form. The E(1)Ca(2) conformation, on the other hand, shows normal phosphorylation with ATP and normal Ca(2+) binding properties, and the rates of the conformational transitions E(1)PCa(2) --> E(2)P and E(2) --> E(1)Ca(2) are only 2- to 3-fold reduced, relative to wild type. These results, which likely can be generalized to other P-type ATPases, indicate that E183 is critical for the phosphatase function of E(2) and E(2)P, possibly interacting with the phosphoryl group or attacking water in the transition state complex, but is of little functional importance in E(1) and E(1)P.


Figures

Scheme 1.
Scheme 1.
Fig. 1.
Fig. 1.
Phosphoenzyme processing. (A) Phosphorylation was carried out for 15 s at 0°C in 40 mM Mops [3-(N-morpholino)propanesulfonic acid]/Tris (pH 7.0), 80 mM KCl, 5 mM MgCl2, 1 mM EGTA, 0.955 mM CaCl2 (10 μM free Ca2+), 10 μM calcium ionophore A23187, and 5 μM[γ-32P]ATP. To measure dephosphorylation, the phosphoenzyme was chased at 0°C by addition of 10 mM EGTA with either 1 mM nonradioactive ATP (open symbols) or 1 mM ADP (filled symbols), and acid quenching was performed at the indicated time intervals. The lines for ATP chase show the best fits of a monoexponential decay function, giving the rate constants indicated in parentheses: open circles, wild type (0.41 s-1); open triangles, E183A (0.010 s-1). For ADP chase, the filled circle corresponds to wild type and the filled triangle corresponds to E183A. (B) Phosphorylation was performed for the indicated time intervals at 0°Cin40mMTES{N-[tris(hydroxymethyl)methyl]-2-aminoethane-sulfonic acid}/Tris (pH 7.8), 80 mM LiCl, 10 mM MgCl2, 50 μM CaCl2, 10 μM calcium ionophore A23187, and 5 μM [γ-32P]ATP, followed by addition of an equal volume of 40 mM TES/Tris (pH 7.8), 80 mM LiCl, 10 mM EGTA, and 2 mM ADP, and acid quenching 4 s later. The lines show the best fits of a monoexponential function, giving the rate constants indicated in parentheses: circles, wild type (0.24 s-1); triangles, E183A (0.13 -1). In each case, the 100% value corresponds to the phosphorylation level reached at infinite time, as deduced from the fit.
Fig. 2.
Fig. 2.
Dephosphorylation of phosphoenzyme formed from 32Pi. Phosphorylation was performed at 25°C for 10 min in 100 mM Mes/Tris (pH 6.0), 2 mM EGTA, 10 mM MgCl2, 30% (vol/vol) dimethyl sulfoxide, and 0.5 mM 32Pi. Dephosphorylation was studied at 0°C by a 19-fold dilution of the phosphorylated (and precooled) sample into 40 mM Mops/Tris (pH 7.0), 2 mM EGTA, 5 mM MgCl2, 80 mM KCl, and 0.5 mM nonradioactive Pi (A)orat25°C by a 19-fold dilution of the phosphorylated sample into 100 mM Mes/Tris (pH 6.0), 2 mM EGTA, 10 mM EDTA, 15% (vol/vol) dimethyl sulfoxide, and 0.5 mM nonradioactive Pi (B), followed by acid quenching at the indicated time intervals. The lines show the best fits of a monoexponential decay function, giving the rate constants (corresponding to A and B, respectively) indicated in parentheses: circles, wild type (0.63 s-1; 0.03 s-1); triangles, E183A (0.005 s-1; 0.002 s-1).
Scheme 2.
Scheme 2.
Fig. 3.
Fig. 3.
Phosphorylation from 32Pi. The reaction was performed at 25°Cin100 mM Mes/Tris (pH 6.0), 2 mM EGTA, 10 mM MgCl2, 15% (vol/vol) (open symbols) or 30% (vol/vol) (filled symbols) dimethyl sulfoxide, and either varying concentrations of 32Pi for 10 min (A)orat0.5mM 32Pi for the indicated time intervals (B). In A, the lines show the best fits of the Hill equation, EP = EPmax · [Pi]n/(K0.5 + [Pi]n) to the data, giving the K0.5 values and Hill numbers, respectively, indicated in parentheses: open circles, wild type (54 μM; 0.95); open triangles, E183A (222 μM; 0.67); filled circles, wild type (11 μM; 0.93); filled triangles, E183A (87 μM; 0.70). In each case, the 100% value corresponds to the phosphorylation level at infinite Pi concentration, as deduced from the fit. In B, the lines show the best fits of a monoexponential function, giving the rate constants indicated in parentheses: circles, wild type (0.73 s-1); triangles, E183A (0.048 s-1). In each case, the 100% value corresponds to the phosphorylation level reached at infinite time, as deduced from the fit.
Fig. 4.
Fig. 4.
Time course of phosphorylation at 25°C from [γ-32P]ATP of enzyme preincubated with (A) and without (B)Ca2+, and of Ca2+ dissociation determined by loss of ability to phosphorylate (C). The experiments were performed by use of quench-flow instrumentation with mixing protocols as described (21, 22). (A) Enzyme preincubated in 40 mM Mops/Tris (pH 7.0), 80 mM KCl, 5 mM MgCl2, and 100 μM CaCl2 was mixed with an equal volume of the same buffer containing 10 μM [γ-32P]ATP, followed by acid quenching at the indicated time intervals. The lines show computer simulations based on Scheme 1, giving rate constants for the E1Ca2E1PCa2 reaction step of 35 s 1 for the wild type and 30 s-1 for E183A (see text for simulation details). (B) Enzyme preincubated in 80 mM KCl, 5 mM MgCl2, 2 mM EGTA, and either 40 mM Mops/Tris (pH 7.0; open symbols) or 40 mM Mes/Tris (pH 6.0; filled symbols) was mixed with an equal volume of 80 mM KCl, 5 mM MgCl2, and 2.2 mM CaCl2,10 μM[γ-32P]ATP, and either 40 mM Mops/Tris (pH 7.0; open symbols) or 40 mM Mes/Tris (pH 6.0; filled symbols), followed by acid quenching at the indicated time intervals. The lines show the best fits of a monoexponential function, giving the rate constants indicated in parentheses: open circles, wild type at pH 7 (20.9 s-1); filled circles, wild type at pH 6 (6.3 s-1); open triangles, E183A at pH 7 (7.7 s-1); filled triangles, E183A at pH 6 (3.2 s-1). (C) Microsomes preincubated in 40 mM Mes/Tris (pH 6.0), 80 mM KCl, 5 mM MgCl2, and 100 μM CaCl2 were mixed with an equal volume of 40 mM Mes/Tris (pH 6.0), 80 mM KCl, 5 mM MgCl2, and 4 mM EGTA. At the indicated time intervals, the double volume of 40 mM Mes/Tris (pH 6.0), 80 mM KCl, 5 mM MgCl2, 2 mM EGTA, and 10 μM [γ-32P]ATP was added, followed by acid quenching 34 ms later. To obtain the point corresponding to zero time, 4 mM EGTA was replaced by 100μM CaCl2. The lines show the best fit of a monoexponential decay function, giving the rate constants indicated in parentheses: circles, wild type (2.9 s-1); triangles, E183A (3.0 s-1).
Fig. 5.
Fig. 5.
Vanadate inhibition of phosphorylation from [γ-32P]ATP. The enzyme was incubated for 1 h at 25°C and subsequently 15 min at 0°C in 40 mM Mops/Tris (pH 7.0), 80 mM KCl, 5 mM MgCl2, 2 mM EGTA, and the indicated concentration of orthovanadate. Phosphorylation was then carried out by sequential addition of 2.5 mM CaCl2 and 5 μM[γ-32P]ATP at 0°C, followed by acid quenching 15 s later. The maximum level of phosphorylation obtained in the absence of vanadate was taken as 100%. The lines show the best fits of the equation EP = EPmax · (1 - [vanadate]n/(K0.5 + [vanadate]n)), giving the K0.5 values indicated in parentheses: circles, wild type (0.17 μM); triangles, E183A (≈250 μM).

References

    1. de Meis, L. & Vianna, A. L. (1979) Annu. Rev. Biochem. 48, 275-292. - PubMed
    1. Inesi, G., Sumbilla, C. & Kirtley, M. E. (1990) Physiol. Rev. 70, 749-776. - PubMed
    1. MacLennan, D. H., Rice, W. J. & Green, N. M. (1997) J. Biol. Chem. 272, 28815-28818. - PubMed
    1. Kaplan, J. H. (2002) Annu. Rev. Biochem. 71, 511-535. - PubMed
    1. Morsomme, P., Slayman, C. W. & Goffeau, A. (2000) Biochim. Biophys. Acta 1469, 133-157. - PubMed

Publication types

MeSH terms