

In silico and transcriptional analysis of carbohydrate uptake systems of Streptomyces coelicolor A3(2)
- PMID: 14973030
- PMCID: PMC344420
- DOI: 10.1128/JB.186.5.1362-1373.2004
In silico and transcriptional analysis of carbohydrate uptake systems of Streptomyces coelicolor A3(2)
Abstract
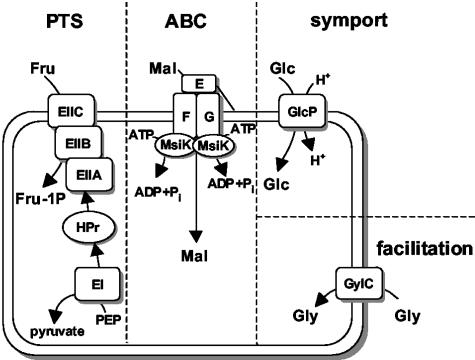
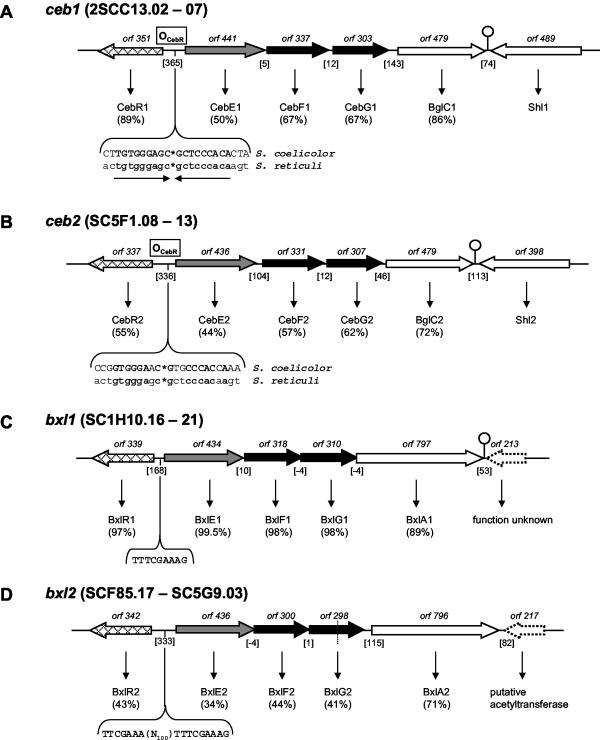
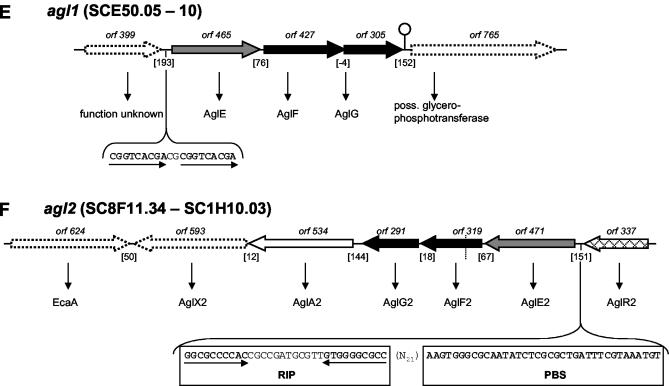
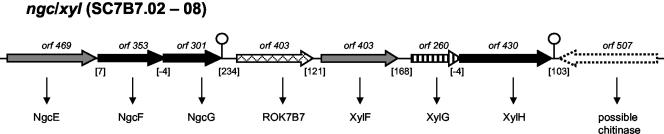
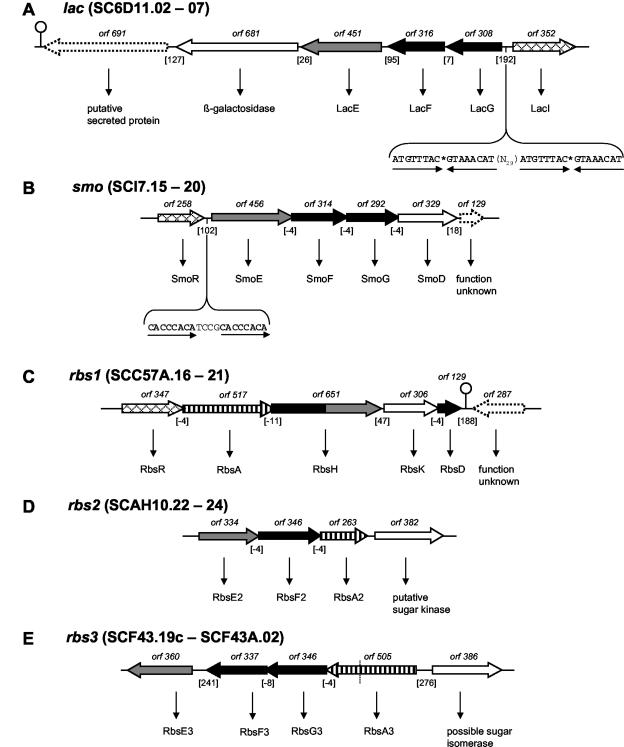
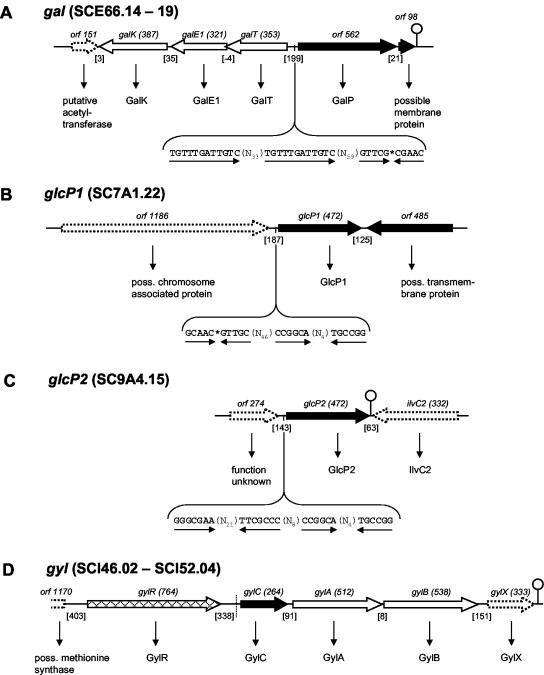
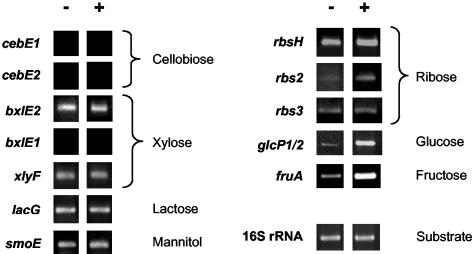
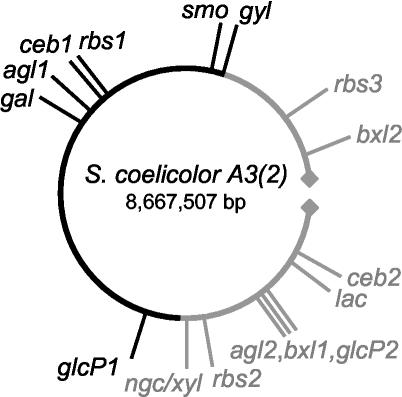
Streptomyces coelicolor is the prototype for the investigation of antibiotic-producing and differentiating actinomycetes. As soil bacteria, streptomycetes can metabolize a wide variety of carbon sources and are hence vested with various specific permeases. Their activity and regulation substantially determine the nutritional state of the cell and, therefore, influence morphogenesis and antibiotic production. We have surveyed the genome of S. coelicolor A3(2) to provide a thorough description of the carbohydrate uptake systems. Among 81 ATP-binding cassette (ABC) permeases that are present in the genome, we found 45 to encode a putative solute binding protein, an essential feature for carbohydrate permease function. Similarity analysis allowed the prediction of putative ABC systems for transport of cellobiose and cellotriose, alpha-glucosides, lactose, maltose, maltodextrins, ribose, sugar alcohols, xylose, and beta-xylosides. A novel putative bifunctional protein composed of a substrate binding and a membrane-spanning moiety is likely to account for ribose or ribonucleoside uptake. Glucose may be incorporated by a proton-driven symporter of the major facilitator superfamily while a putative sodium-dependent permease of the solute-sodium symporter family may mediate uptake of galactose and a facilitator protein of the major intrinsic protein family may internalize glycerol. Of the predicted gene clusters, reverse transcriptase PCRs showed active gene expression in 8 of 11 systems. Together with the previously surveyed permeases of the phosphotransferase system that accounts for the uptake of fructose and N-acetylglucosamine, the genome of S. coelicolor encodes at least 53 potential carbohydrate uptake systems.
Figures
Similar articles
-
The msiK gene, encoding the ATP-hydrolysing component of N,N'-diacetylchitobiose ABC transporters, is essential for induction of chitinase production in Streptomyces coelicolor A3(2).Microbiology (Reading). 2008 Nov;154(Pt 11):3358-3365. doi: 10.1099/mic.0.2008/019612-0. Microbiology (Reading). 2008. PMID: 18957589
-
A new GntR family transcriptional regulator in streptomyces coelicolor is required for morphogenesis and antibiotic production and controls transcription of an ABC transporter in response to carbon source.J Bacteriol. 2006 Nov;188(21):7477-87. doi: 10.1128/JB.00898-06. Epub 2006 Aug 25. J Bacteriol. 2006. PMID: 16936034 Free PMC article.
-
A genomic view of sugar transport in Mycobacterium smegmatis and Mycobacterium tuberculosis.J Bacteriol. 2007 Aug;189(16):5903-15. doi: 10.1128/JB.00257-07. Epub 2007 Jun 8. J Bacteriol. 2007. PMID: 17557815 Free PMC article.
-
Transporters of glucose and other carbohydrates in bacteria.Pflugers Arch. 2020 Sep;472(9):1129-1153. doi: 10.1007/s00424-020-02379-0. Epub 2020 May 6. Pflugers Arch. 2020. PMID: 32372286 Review.
-
The glucose uptake systems in Corynebacterium glutamicum: a review.World J Microbiol Biotechnol. 2020 Jul 26;36(9):126. doi: 10.1007/s11274-020-02898-z. World J Microbiol Biotechnol. 2020. PMID: 32712859 Review.
Cited by
-
An expression-driven approach to the prediction of carbohydrate transport and utilization regulons in the hyperthermophilic bacterium Thermotoga maritima.J Bacteriol. 2005 Nov;187(21):7267-82. doi: 10.1128/JB.187.21.7267-7282.2005. J Bacteriol. 2005. PMID: 16237010 Free PMC article.
-
Nitrogen regulator GlnR controls uptake and utilization of non-phosphotransferase-system carbon sources in actinomycetes.Proc Natl Acad Sci U S A. 2015 Dec 22;112(51):15630-5. doi: 10.1073/pnas.1508465112. Epub 2015 Dec 7. Proc Natl Acad Sci U S A. 2015. PMID: 26644570 Free PMC article.
-
The ROK family regulator Rok7B7 pleiotropically affects xylose utilization, carbon catabolite repression, and antibiotic production in streptomyces coelicolor.J Bacteriol. 2013 Mar;195(6):1236-48. doi: 10.1128/JB.02191-12. Epub 2013 Jan 4. J Bacteriol. 2013. PMID: 23292782 Free PMC article.
-
Evaluation of Soil Streptomyces spp. for the Biological Control of Fusarium Wilt Disease and Growth Promotion in Tomato and Banana.Plant Pathol J. 2023 Feb;39(1):108-122. doi: 10.5423/PPJ.OA.08.2022.0124. Epub 2023 Feb 1. Plant Pathol J. 2023. PMID: 36760053 Free PMC article.
-
The global role of ppGpp synthesis in morphological differentiation and antibiotic production in Streptomyces coelicolor A3(2).Genome Biol. 2007;8(8):R161. doi: 10.1186/gb-2007-8-8-r161. Genome Biol. 2007. PMID: 17683547 Free PMC article.
References
-
- Angell, S., C. G. Lewis, M. J. Buttner, and M. J. Bibb. 1994. Glucose repression in Streptomyces coelicolor A3(2): a likely regulatory role for glucose kinase. Mol. Gen. Genet. 244:135-143. - PubMed
-
- Angell, S., E. Schwarz, and M. J. Bibb. 1992. The glucose kinase gene of Streptomyces coelicolor A3(2): its nucleotide sequence, transcriptional analysis and role in glucose repression. Mol. Microbiol. 6:2833-2844. - PubMed
-
- Beijer, L., R. P. Nilsson, C. Holmberg, and L. Rutberg. 1993. The glpP and glpF genes of the glycerol regulon in Bacillus subtilis. J. Gen. Microbiol. 139:349-359. - PubMed
Publication types
MeSH terms
Substances
LinkOut - more resources
Full Text Sources
Other Literature Sources
Molecular Biology Databases
Research Materials
