. 2004 Mar;16(3):616-28.
doi: 10.1105/tpc.019398. Epub 2004 Feb 18.

Plant respiratory burst oxidase homologs impinge on wound responsiveness and development in Lycopersicon esculentum

Affiliations

Plant respiratory burst oxidase homologs impinge on wound responsiveness and development in Lycopersicon esculentum

Moshe Sagi et al. Plant Cell. 2004 Mar.

Abstract

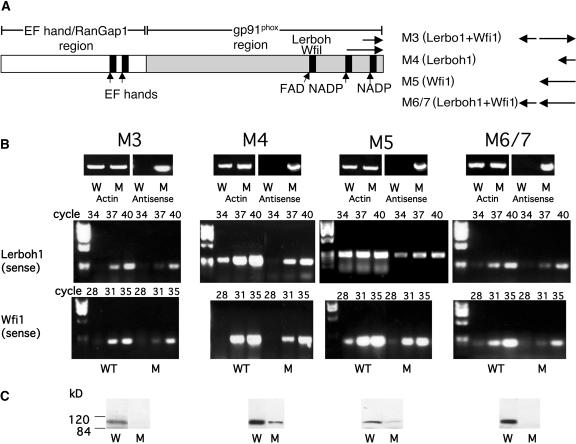
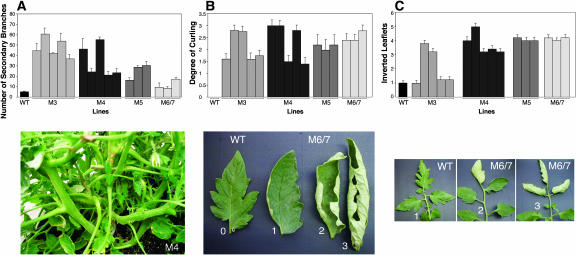
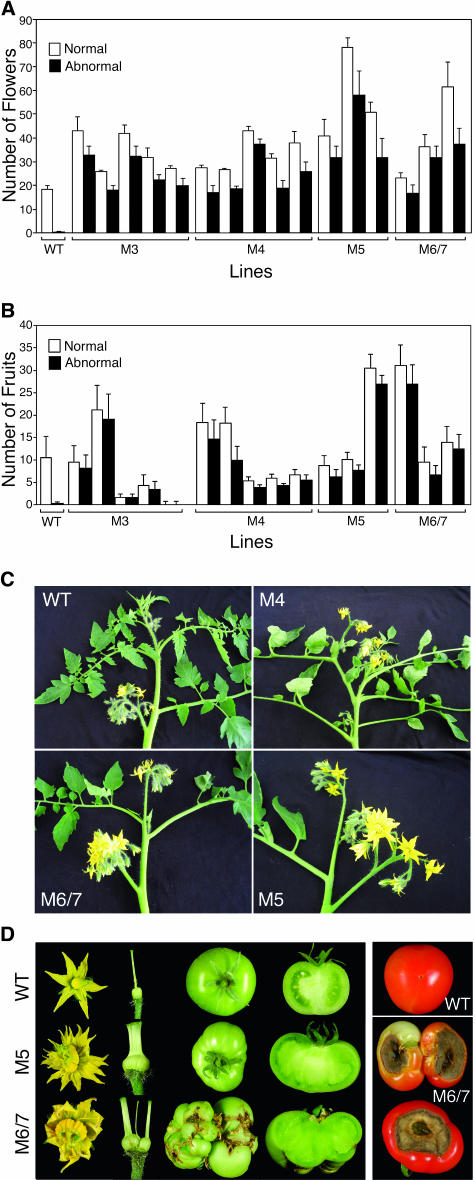
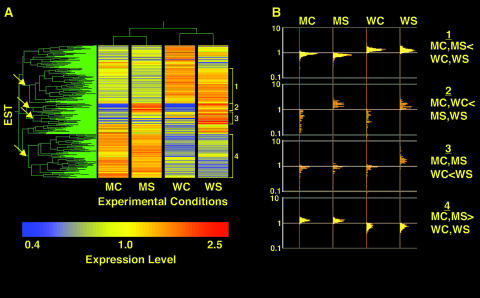
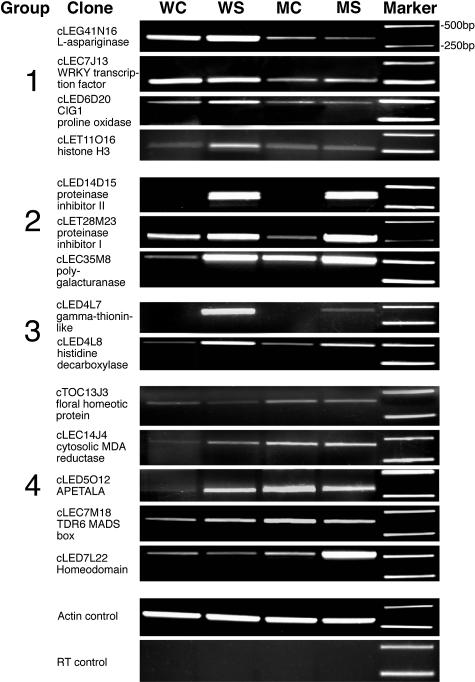
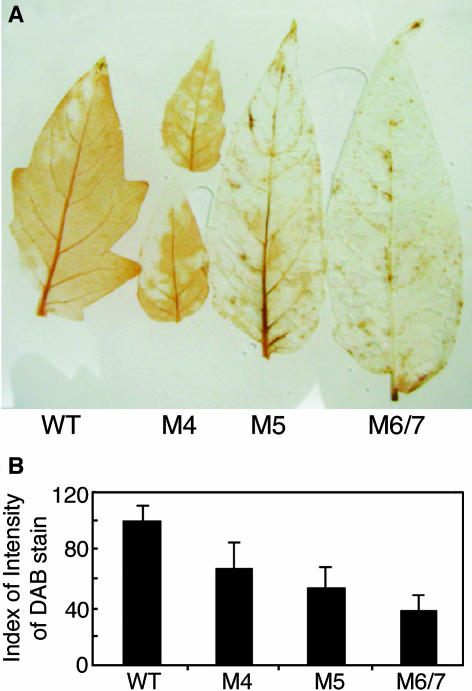
Plant respiratory burst oxidase homologs (Rboh) are homologs of the human neutrophil pathogen-related gp91(phox). Antisense technology was employed to ascertain the biological function of Lycopersicon esculentum (tomato) Rboh. Lines with diminished Rboh activity showed a reduced level of reactive oxygen species (ROS) in the leaf, implying a role for Rboh in establishing the cellular redox milieu. Surprisingly, the antisense plants acquired a highly branched phenotype, switched from indeterminate to determinate growth habit, and had fasciated reproductive organs. Wound-induced systemic expression of proteinase inhibitor II was compromised in the antisense lines, indicating that ROS intermediates supplied by Rboh are required for this wound response. Extending these observations by transcriptome analysis revealed ectopic leaf expression of homeotic MADS box genes that are normally expressed only in reproductive organs. In addition, both Rboh-dependent and -independent wound-induced gene induction was detected as well as transcript changes related to redox maintenance. The results provide novel insights into how the steady state cellular level of ROS is controlled and portrays the role of Rboh as a signal transducer of stress and developmental responses.


Figures

Figure 1.
Figure 1.
Expression of Lerboh1 and Wfi1 Transcripts and Rboh Polypeptide Levels in Antisense Plants. (A) Schematic presentation of L. esculentum Rboh showing gp91phox, EF hand, and RanGap homology regions. The location of the antisense fragments of Lerboh1 and Wfi1 are shown in the C-terminal region. The combinations of inserts used in constructs M3 to M6/7 are shown at the right. Fragment types are indicated in parenthesis, and the insert orientations are indicated at the right. Arrows pointing to the left or right represent antisense and sense orientations, respectively. (B) RT-PCR expression analysis of antisense construct and Lerboh1 and Wfi1 sense expressions in wild-type (W) and antisense (M) plants. Top panels; RT-PCR product of antisense expression transcript showing fragments of 810, 293, 648, and 927 bp for M3, M4, M5, and M6/7, respectively; middle panels, RT-PCR of endogenous Lerboh1 sense transcript showing the expected PCR fragment of 270 bp; bottom panels, RT-PCR of endogenous Wfi1 sense transcript showing the expected PCR products of 213 bp. L. esculentum actin (Tom41 actin gene, U60480) was used as a standard, and the expected PCR product of a 325-bp fragment is shown. The data are representative of results obtained in at least four independent lines. (C) Immunoblot analysis of L. esculentum Rboh levels in wild-type (W) and transgenic antisense (M) lines. Proteins were extracted from wild-type and antisense leaves and fractionated (100 μg per lane) by denaturating SDS-PAGE and immunoblotted with antisera against the C-terminal portion of the L. esculentum Rboh. The data are representative of results obtained in at least four independent lines.
Figure 3.
Figure 3.
Characterization of Vegetative Growth of Rboh Antisense Plants. (A) Top panel, quantitative chart of appearance of secondary branches in wild-type and antisense plants. Each column represents an independent antisense line. Bottom panel, antisense plant line M4 showing a bushy phenotype. (B) Top panel, quantitative chart of appearance of leaf curl in wild-type and antisense plants. Each column in the chart represents an independent antisense line. The analysis was performed using a 0 to 3 severity score as shown in the bottom panel, with 0 representing the wild type and 3 representing the most severe curling. (C) Top panel, quantitative analysis of inverted leaflets in wild-type and antisense plants. Each column in the chart represents an independent antisense line. The analysis was performed using a 1 to 5 severity score (see Methods). The bottom panel illustrates wild-type leaflets and leaflets from an antisense line.
Figure 4.
Figure 4.
Characterization of Reproductive Organs in Rboh Antisense Plants. (A) Chart of normal versus abnormal flowers counted in 100-d-old wild-type and antisense plants. Each black-and-white column pair in the chart represents an independent antisense line. (B) Chart of normal versus abnormal fruits counted in 150-d-old wild-type and antisense plants. Each black-and-white column pair in the chart represents an independent antisense line. (C) Growth habit in wild-type and M4, M5, and M6/7 lines. (D) Left panel, flower, styles, ovaries, and whole and sliced green fruit of the wild type (top row), antisense M5 (middle row), and antisense M6/7 plants (bottom row). Right panel, BER illustrated in M6/7 lines (middle and bottom) compared with normal parental fruit (top).
Figure 5.
Figure 5.
Protein Gel Blot Analysis of L. esculentum Rboh Protein in Leaves Exposed to Select Phytohormones. Plants (28 d) were placed in solutions containing 50 μM ABA, GA, IAA, BA, or the ethylene precursor ACC. After 24 h, proteins were extracted from the second upper leaf and fractionated (100 μg per lane) by denaturating SDS-PAGE and immunoblotted with antiserum against the C-terminal portion of the L. esculentum Rboh (Sagi and Fluhr, 2001).
Figure 6.
Figure 6.
ROS and PIN II Production in the Systemic Leaf of Wild-Type and Antisense Plants 24 h after Wounding. (A) ROS accumulation in control and systemic leaves of wild-type and antisense (M) L. esculentum plants 5 h after wounding. Plants were imbibed with DAB for 3 h. Subsequently, lower leaves were wounded. Five hours later, leaves from unwounded control plants and upper systemic leaves of wounded plants were assayed for DAB staining. Brown precipitates correlate with the presence of H2O2. (B) Quantitative analysis of DAB staining. Quantitative measurements were performed as described in the Methods. Each point represents the mean of four terminal leaflets derived from four different plants. Bars represent se. (C) Protein gel blot analysis of PIN II protein accumulation in control and systemic leaves of wild-type and antisense L. esculentum plants 24 h after wounding. Leaves of the same size and position in unwounded plants served as controls. Proteins were extracted and fractionated (100 μg per lane) by denaturating SDS-PAGE and immunoblotted with antiserum against PIN II.
Figure 7.
Figure 7.
Microarray Analysis of Leaves of Nonwounded Plants and the Systemic Leaves of Wounded Plants from Wild-Type and Transgenic M6/7 Lines. (A) Double clustering analysis of transcripts showing a change in expression level (one-way ANOVA equal variance, P ≤ 0.05) in either control or systemic leaves of wild-type or antisense plants in the four experimental conditions. Each condition is the averaged result of two to three independent biological replicates. The conditions are as follows: MC, mutant control leaf; MS, mutant systemic leaf; WC, wild-type control leaf; WS, wild-type systemic leaf. The arrows point to selected clusters that are assigned numbers (brackets) corresponding to four groups (described in [B]). (B) Log scale distribution of individual transcript activity in the selected groups.
Figure 8.
Figure 8.
RT-PCR Analysis of Transcript Levels of Select ESTs. Primers were synthesized for select ESTs in Table 1, and quantitative PCR was performed as described in the Methods. All PCR products were confirmed by sequence. WC, WS, MC, and MS are as in Figure 7.
Figure 2.
Figure 2.
H2O2 Production in Wild-Type and Antisense Leaves. (A) Constitutive levels of H2O2 in leaves were visualized by DAB staining of the terminal leaflet of the first fully expanded leaves sampled from wild-type and Rboh transgenic 45-d-old plants. Leaflets were collected and vacuum-infiltrated with the DAB solution. The sampled leaves were placed in a plastic box under high humidity for DAB-H2O2 staining development. (B) Quantitative analysis of DAB staining. Quantitative measurements were performed as described in the Methods. Each point represents the mean of four terminal leaflets derived from four different plants. Bars represent se.

References

    1. Ahmad, K., and Henikoff, S. (2002). The histone variant H3.3 marks active chromatin by replication-independent nucleosome assembly. Mol. Cell 9, 1191–1200. - PubMed
    1. Allan, A.C., and Fluhr, R. (1997). Two distinct sources of elicited reactive oxygen species in tobacco epidermal cells. Plant Cell 9, 1559–1572. - PMC - PubMed
    1. Baker, C.J., and Orlandi, E.W. (1995). Active oxygen in plant pathogenesis. Annu. Rev. Phytopathol. 33, 299–321. - PubMed
    1. Banfi, B., Molnar, G., Maturana, A., Steger, K., Hegedus, B., Demaurex, N., and Krause, K.H. (2001). A Ca2+-activated NADPH oxidase in testis, spleen, and lymph nodes. J. Biol. Chem. 276, 37594–37601. - PubMed
    1. Bokoch, G.M., Bohl, B.P., and Chuang, T.H. (1994). Guanine-nucleotide exchange regulates membrane translocation of Rac/Rho GTP-binding proteins. J. Biol. Chem. 269, 31674–31679. - PubMed

Publication types

MeSH terms