

Trends between gene content and genome size in prokaryotic species with larger genomes
- PMID: 14973198
- PMCID: PMC365760
- DOI: 10.1073/pnas.0308653100
Trends between gene content and genome size in prokaryotic species with larger genomes
Abstract
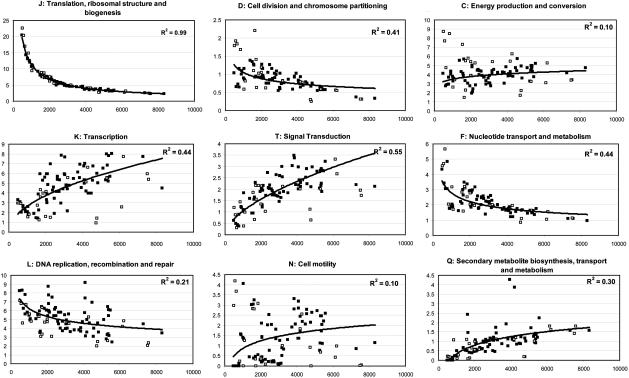
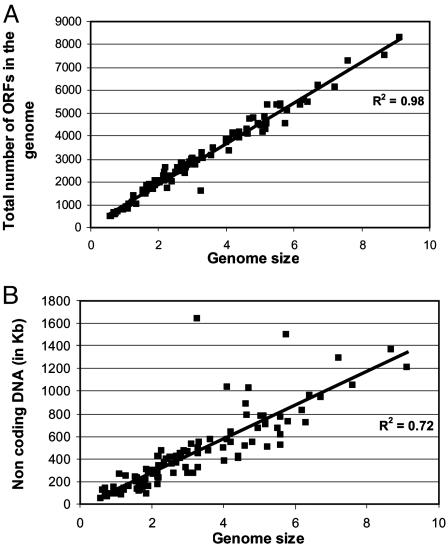
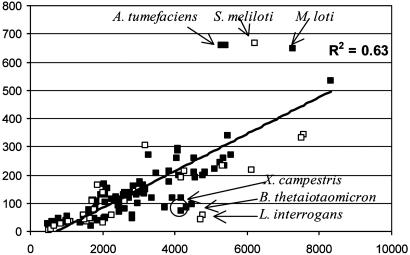
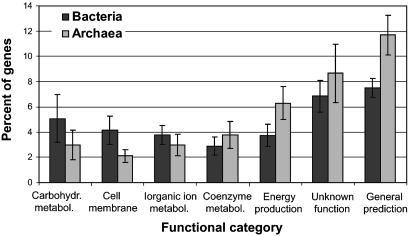
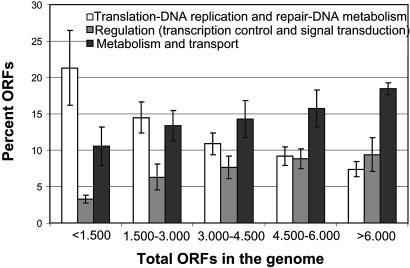
Although the evolution process and ecological benefits of symbiotic species with small genomes are well understood, these issues remain poorly elucidated for free-living species with large genomes. We have compared 115 completed prokaryotic genomes by using the Clusters of Orthologous Groups database to determine whether there are changes with genome size in the proportion of the genome attributable to particular cellular processes, because this may reflect both cellular and ecological strategies associated with genome expansion. We found that large genomes are disproportionately enriched in regulation and secondary metabolism genes and depleted in protein translation, DNA replication, cell division, and nucleotide metabolism genes compared to medium- and small-sized genomes. Furthermore, large genomes do not accumulate noncoding DNA or hypothetical ORFs, because the portion of the genome devoted to these functions remained constant with genome size. Traits other than genome size or strain-specific processes are reflected by the dispersion around the mean for cell functions that showed no correlation with genome size. For example, Archaea had significantly more genes in energy production, coenzyme metabolism, and the poorly characterized category, and fewer in cell membrane biogenesis and carbohydrate metabolism than Bacteria. The trends we noted with genome size by using Clusters of Orthologous Groups were confirmed by our independent analysis with The Institute for Genomic Research's Comprehensive Microbial Resource and Kyoto Encyclopedia of Genes and Genomes' Orthology annotation databases. These trends suggest that larger genome-sized species may dominate in environments where resources are scarce but diverse and where there is little penalty for slow growth, such as soil.
Figures
References
-
- Andersson, S. & Kurland, C. (1998) Trends Microbiol. 6, 263-268. - PubMed
-
- Galperin, M. & Koonin, E. (1999) Genetica 106, 159-170. - PubMed
-
- Moran, N. (2002) Cell 108, 583-586. - PubMed
-
- Andersson, S., Zomorodipour, A., Andersson, J., Sicheritz-Pontent, T., Alsmark, U., Podowski, R., Naslund, A., Eriksson, A., Winkler, H. & Kurland, C. (1998) Nature 396, 109-110. - PubMed
-
- Fraser, C, Gocanye, J., White, O., Adams, M., Clayton, R., Fleischmann, R., Bult, D., Kerlavage, A., Sutton, G., Kelly, J., et al. (1995) Science 270, 397-403. - PubMed
Publication types
MeSH terms
Substances
LinkOut - more resources
Full Text Sources
Other Literature Sources
