. 2004 Feb 18;32(3):1197-207.
doi: 10.1093/nar/gkh271. Print 2004.

A novel strategy to engineer DNA polymerases for enhanced processivity and improved performance in vitro

Affiliations

A novel strategy to engineer DNA polymerases for enhanced processivity and improved performance in vitro

Yan Wang et al. Nucleic Acids Res. .

Abstract

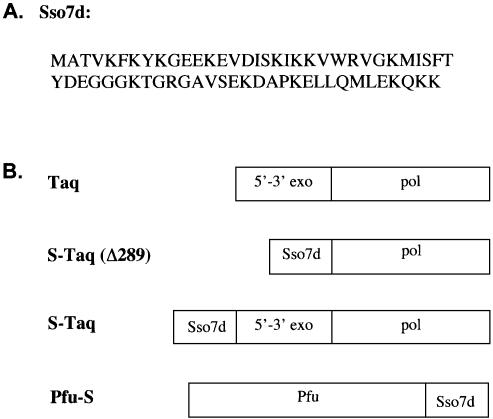
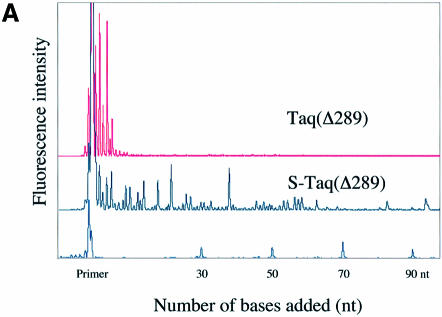
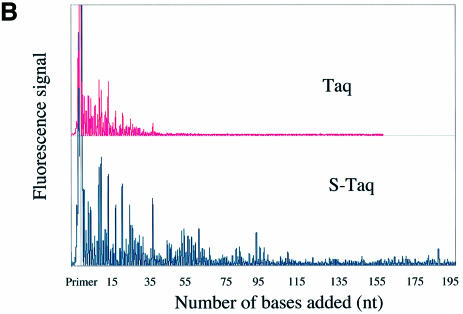
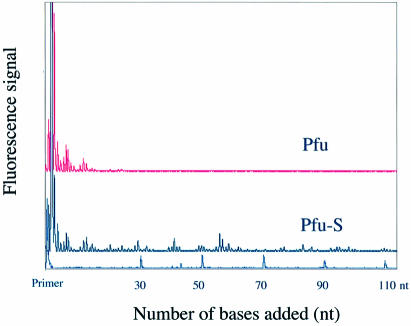
Mechanisms that allow replicative DNA polymerases to attain high processivity are often specific to a given polymerase and cannot be generalized to others. Here we report a protein engineering-based approach to significantly improve the processivity of DNA polymerases by covalently linking the polymerase domain to a sequence non-specific dsDNA binding protein. Using Sso7d from Sulfolobus solfataricus as the DNA binding protein, we demonstrate that the processivity of both family A and family B polymerases can be significantly enhanced. By introducing point mutations in Sso7d, we show that the dsDNA binding property of Sso7d is essential for the enhancement. We present evidence supporting two novel conclusions. First, the fusion of a heterologous dsDNA binding protein to a polymerase can increase processivity without compromising catalytic activity and enzyme stability. Second, polymerase processivity is limiting for the efficiency of PCR, such that the fusion enzymes exhibit profound advantages over unmodified enzymes in PCR applications. This technology has the potential to broadly improve the performance of nucleic acid modifying enzymes.


Figures

Figure 1
Figure 1
(A) Amino acid sequence of Sso7d protein. (B) Schematic representation of the domain organization of Taq polymerase and the Sso7d fusion proteins.
Figure 2
Figure 2
Processivity analyses of Taq-based polymerases. Each trace represents one lane from a sequencing gel and each peak represents a single primer extension product. Reaction time was 5 min for each enzyme. (A) Electropherogram traces of Taq(Δ289) (10 pM) and S-Taq(Δ289) (16 pM). The size marker lane is shown at the bottom and the corresponding primer extension product length is indicated on the x-axis. (B) Electro pherogram traces of Taq (4 pM) and S-Taq (20 pM). The labels on the x-axis indicate the primer extension product length, which is determined based on size markers run on the same gel (trace not shown).
Figure 2
Figure 2
Processivity analyses of Taq-based polymerases. Each trace represents one lane from a sequencing gel and each peak represents a single primer extension product. Reaction time was 5 min for each enzyme. (A) Electropherogram traces of Taq(Δ289) (10 pM) and S-Taq(Δ289) (16 pM). The size marker lane is shown at the bottom and the corresponding primer extension product length is indicated on the x-axis. (B) Electro pherogram traces of Taq (4 pM) and S-Taq (20 pM). The labels on the x-axis indicate the primer extension product length, which is determined based on size markers run on the same gel (trace not shown).
Figure 3
Figure 3
Electropherogram traces of Pfu and Pfu-S for the processivity analysis. Size markers and the corresponding primer extension product length are shown at the bottom. The polymerase concentrations were 16 pM for Pfu and 80 pM for Pfu-S. The reaction buffer for both enzymes contained 20 mM Tris–HCl (pH 8.8), 10 mM KCl, 10 mM (NH4)2SO4, 0.1% Triton X-100 and 100 µg/ml BSA. The reaction time was 5 min.
Figure 4
Figure 4
Thermal stability analyses of fusion and non-fusion proteins using primer extension assay. See Materials and Methods for detailed description of reaction conditions and data analyses. The buffers used during the 97.5°C incubation were 10 mM Tris–HCl pH 8.8, 50 mM KCl, 2 mM MgCl2 and 0.1% Triton X-100 for Taq(Δ289) (open circles) and S-Taq(Δ289) (solid circles), 20 mM Tris–HCl (pH 8.8), 10 mM KCl, 10 mM (NH4)2SO4, 2 mM MgCl2, 0.1% Triton X-100 and 100 µg/ml BSA for Pfu (open squares) and Pfu buffer with 60 mM KCl for Pfu-S (solid squares).
Figure 5
Figure 5
Comparison of PCR efficiency of Taq, Taq(Δ289) and S-Taq(Δ289). λ DNA (130 pg/µl) was used as the template and the sizes of the amplicons are indicated at the bottom. The PCR buffer contained 10 mM Tris–HCl pH 8.8, 2 mM MgCl2, 200 µM each dNTPs and 0.1% Triton-100 with 10 mM KCl for Taq(Δ289) and 50 mM KCl for S-Taq(Δ289) and Taq. The cycling protocol was: 95°C for 20 s; 20 cycles of 94°C for 5 s and 72°C for 30 s (A) or for 60 s (B) or for 2 min (C); 72°C for 7 min.
Figure 6
Figure 6
Comparison of PCR efficiency of Pfu and Pfu-S. λ DNA (130 pg/µl) was used as the template and the sizes of the amplicons are indicated at the bottom. M indicates molecular weight marker. PCR buffer contained 20 mM Tris–HCl pH 8.8, 10 mM (NH4)2SO4, 0.1% Triton-100, 2 mM MgCl2 and 200 µM each dNTPs with 10 mM KCl for Pfu and 60 mM KCl for Pfu-S. The cycling protocol was 95°C for 20 s; 20 cycles of 94°C for 5 s and 72°C for 30 s (A) or for 60 s (B) or for 2 min (C); 72°C for 7 min.
Figure 7
Figure 7
Comparison of the salt tolerance of Sso7d fusions and the unmodified enzymes in PCR. λ DNA (130 pg/µl) was used as the template and a 0.9 kb amplicon was amplified in PCR buffer with increasing KCl concentrations. Lanes 1–12: 10, 20, 30, 40, 50, 60, 80, 100, 120, 140, 160 and 180 mM KCl. For Pfu and Pfu-S the PCR buffer contained 20 mM Tris–HCl pH 8.8, 10 mM (NH4)2SO4, 2 mM MgCl2, 0.1% Triton-100, 100 µg/ml BSA and 200 µM each dNTPs. For the other enzymes the PCR buffer contained 10 mM Tris–HCl pH 8.8, 2 mM MgCl2, 0.1% Triton-100 and 200 µM each dNTPs. The cycling protocol was 95°C for 20 s; 20 cycles of 94°C for 5 s and 72°C for 60 s; 72°C for 10 min. M indicates molecular weight marker.

References

    1. Kornberg A. and Baker,T.A. (1992) DNA Replication, 2nd edn. W.H.Freeman, New York, NY.
    1. Nakai H., Beauchamp,B.B., Bernstein,J., Huber,H.E., Tabor,S. and Richardson,C.C. (1988) Formation and Propagation of the Bacteriophage T7 Replication Fork. American Society of Microbiology, Washington, DC.
    1. Bambara R.A., Uyemura,D. and Choi,T. (1978) On the processive mechanism of Escherichia coli DNA polymerase I. Quantitative assessment of processivity. J. Biol. Chem., 253, 413–423. - PubMed
    1. Das S.K. and Fujimura,R.K. (1977) Mechanism of T5-induced DNA polymerase. I. Replication of short primer templates. J. Biol. Chem., 252, 8700–8707. - PubMed
    1. Das S.K. and Fujimura,R.K. (1977) Mechanism of T5-induced DNA polymerase. II. Characterization of the dead-end complex. J. Biol. Chem., 252, 8708–8712. - PubMed

Publication types

MeSH terms