. 2004 Feb 18;32(3):1177-83.
doi: 10.1093/nar/gkh288. Print 2004.

Identification of NH...N hydrogen bonds by magic angle spinning solid state NMR in a double-stranded RNA associated with myotonic dystrophy

Affiliations

Identification of NH...N hydrogen bonds by magic angle spinning solid state NMR in a double-stranded RNA associated with myotonic dystrophy

Jörg Leppert et al. Nucleic Acids Res. .

Abstract

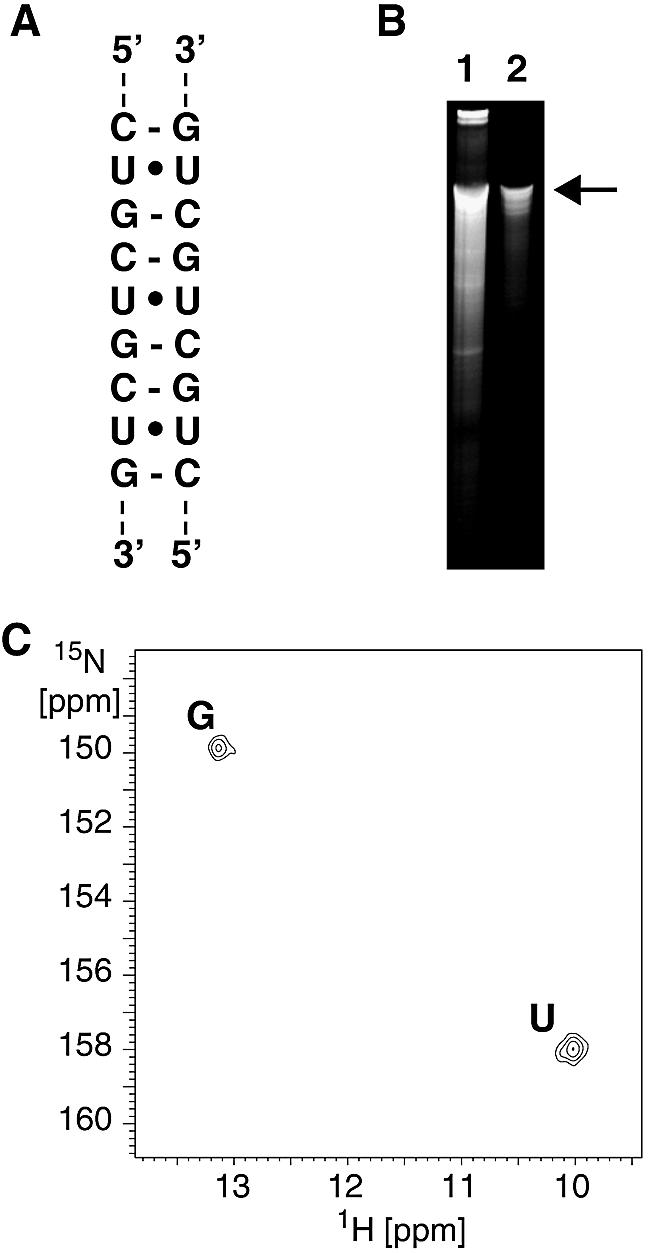
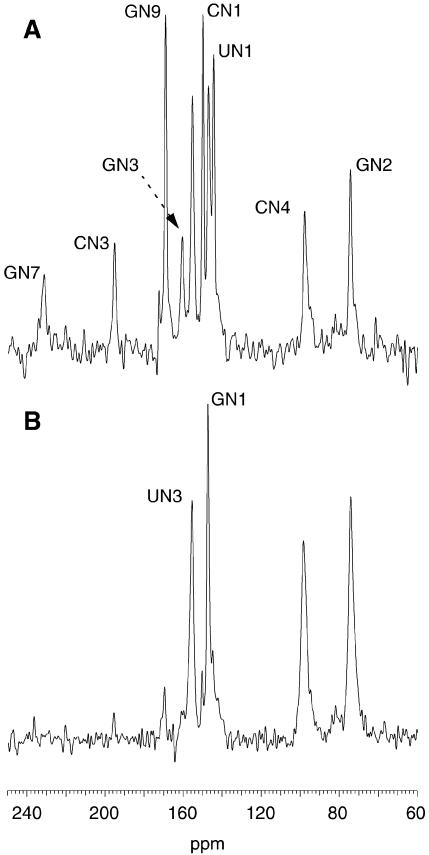
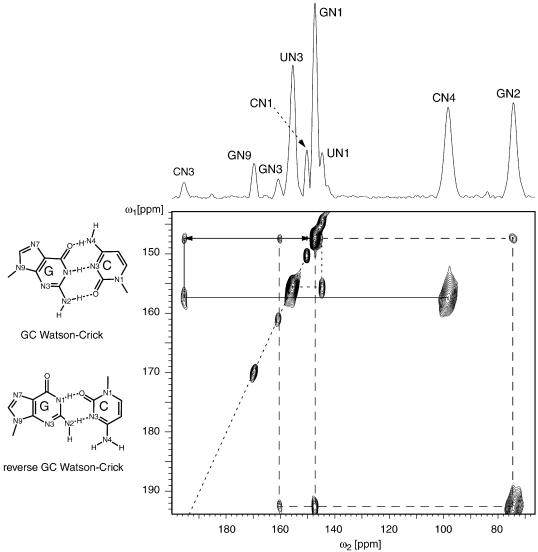
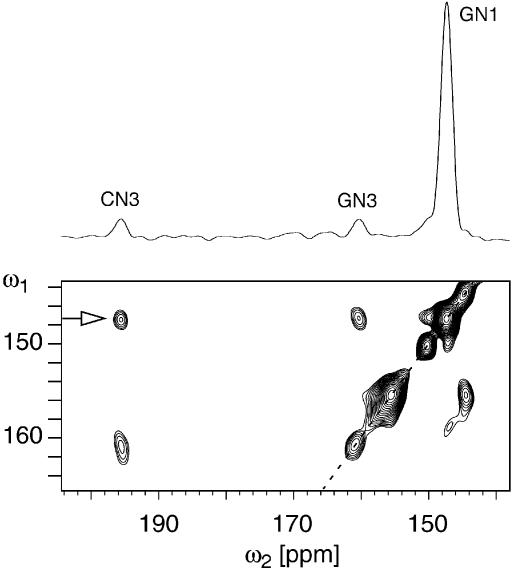
RNA plays a central role in biological processes and exhibits a variety of secondary and tertiary structural features that are often stabilized via hydrogen bonds. The distance between the donor and acceptor nitrogen nuclei involved in NH...N hydrogen bonds in nucleic acid base pairs is typically in the range of 2.6-2.9 A. Here, we show for the first time that such spatial proximity between 15N nitrogen nuclei can be conveniently monitored via magic angle spinning solid state NMR on a uniformly 15N-labelled RNA. The presence of NH.N hydrogen bonds is reflected as cross-peaks between the donor and acceptor nitrogen nuclei in 2D 15N dipolar chemical shift correlation spectra. The RNA selected for this experimental study was a CUG repeat expansion implicated in the neuromuscular disease myotonic dystrophy. The results presented provide direct evidence that the CUG repeat expansion adopts a double-stranded conformation.


Figures

Figure 1
Figure 1
The RF pulse sequence employed for obtaining 15N MAS dipolar chemical shift correlation spectra in the solid state. The sequence involves a conventional CP transfer from the 1H nuclei to the 15N nuclei under Hartmann–Hahn matching conditions. Following CP, the 15N magnetization evolves for a period t1 under the isotropic 15N isotropic chemical shifts. The non-selective π/2 pulse applied at the end of t1 restores the transverse nitrogen magnetization to the z axis. During the mixing period Nτr dipolar recoupling is achieved via rotor-synchronized adiabatic inversion pulses with one pulse per rotor period and by employing the [p5m4] or [p5p7m4] phasing scheme (see text) for the inversion pulses. The final 15N π/2 pulse returns the 15N magnetization to the transverse plane for detection.
Figure 2
Figure 2
Simulated adiabatic inversion pulse driven longitudinal magnetization transfer characteristics. The plots show the magnitude of the transferred magnetization (normalized to the maximum transferable signal) at the CN3 nitrogen spin starting with z magnetization on spin GN1 at zero recoupling time. Considering a four-spin dipolar network, simulations were carried out at a spinning speed of 7000 Hz, with ‘cagauss’ adiabatic pulses (142 µs, 28.0 kHz γH1, 50 kHz sweep width) (23,32) employing the [p5m4] phasing scheme and in time increments of 20 rotor periods. The resulting data points were interpolated to provide visual clarity. The plots show the dependence of the initial rate of build-up on the dipolar coupling strength D between the nuclei GN1 and CN3. Based on available internuclear distance data, the dipolar coupling strengths between the other nuclei were fixed at the values indicated. All simulations were carried out keeping the RF carrier on resonance with spin GN1, neglecting CSAs and employing resonance offsets Δδ of –3556, 818 and 2580 Hz for the GN2, GN3 and CN3 nuclei. The orientations of the dipolar vectors are taken from a SYBYL (Tripos Inc., San Louis, USA) generated A-form RNA duplex with a self-complementary CUGCUGCUG sequence and using the SIMMOL program to calculate the mutual orientations in an arbitrary molecular frame.
Figure 3
Figure 3
(A) Schematic representation of dsCUG. (B) Denaturing polyacrylamide gel electrophoresis of (1) the total 15N-labelled RNA synthesized in a 15 ml in vitro transcription reaction and (2) (CUG)97 RNA after purification and refolding. The arrow points to the full-length transcript. (C) A 1H–15N HSQC spectrum of a 200 µM (CUG)97 sample taken at 15°C; G and U denote the cross-peaks of the imino groups of the G and U nucleotides of (CUG)97.
Figure 4
Figure 4
A 15N CPMAS spectrum of the lyophylized and rehydrated RNA sample obtained at a spinning speed of 7000 Hz and temperature of approximately –15°C employing a data acquisition time of 20 ms with CP contact time of (A) 3 ms and (B) 175 µs. Spectra A and B were respectively collected employing a recycle time of 10 s and 2 s and with 1296 and 512 transients. The chemical shifts are referenced to liquid NH3 assuming that solid NH4Cl has a chemical shift of 38.5 p.p.m.
Figure 5
Figure 5
Experimental 15N dipolar chemical shift correlation spectrum of the lyophylized and rehydrated RNA sample (zoomed plot) obtained at a spinning speed of 7000 Hz, with a data acquisition in the direct dimension of 10 ms, dipolar recoupling period of 20 ms, CP contact time of 175 µs, recycle time of 4.1 s, ω1 spectral width of 3000 Hz and 32 t1 increments with 512 transients per t1 increment. The RF carrier was kept at 164.6 p.p.m.. The amino nitrogen lines are folded in the ω1 dimension. Dipolar recoupling was effected by employing the [p5p7m4] phasing scheme with ‘cagauss’ adiabatic pulses (142 µs, 28.0 kHz γH1, 50 kHz sweep width) (23,32) as implemented in the Varian Pbox pulse-shaping software. The assignments of the different resonances are indicated in the spectral projection given. Also illustrated are the normal and reverse GC Watson–Crick base-pairing schemes. The spectral diagonal is indicated by a dotted line.
Figure 6
Figure 6
Experimental 15N dipolar chemical shift correlation spectrum for the redissolved and frozen RNA sample (zoomed plot) obtained with a dipolar recoupling period of 14.28 ms, ω1 spectral width of 3200 Hz and 32 t1 increments with 640 transients per t1 increment. Dipolar recoupling was effected by employing the [p5m4] phasing scheme. The spectral cross- section taken at the position indicated is also given at the top of the 2D spectrum. Other parameters employed were as in Figure 5. The spectral diagonal is indicated by a dotted line.

References

    1. Gesteland R.F., Atkins,J.F. and Cech,T.R. (1999) The RNA World (2nd edn). Cold Spring Harbor Laboratory Press, Cold Spring Harbor, NY.
    1. Ohlenschlager O., Wohnert,J., Ramachandran,R., Sich,C. and Gorlach,M. (2003) Nuclear magnetic resonance studies of ribonucleic acids. Spectroscopy, 17, 537–547.
    1. Furtig B., Richter,C., Wohnert,J. and Schwalbe,H. (2003) NMR spectroscopy of RNA. Chembiochem, 4, 936–962. - PubMed
    1. Ohlenschlager O., Wohnert,J., Bucci,E., Seitz,S., Hafner,S., Ramachandran,R., Zell,R. and Gorlach,M. (2004) The structure of the stemloop D subdomain of Coxsackievirus B3 cloverleaf RNA and its interaction with the proteinase 3C. Structure, in press. - PubMed
    1. Stoldt M., Wohnert,J., Ohlenschlager,O., Gorlach,M. and Brown,L.R. (1999) The NMR structure of the 5S rRNA E-domain-protein L25 complex shows preformed and induced recognition. EMBO J., 18, 6508–6521. - PMC - PubMed

Publication types

MeSH terms