. 2004 Feb 18;24(7):1726-33.
doi: 10.1523/JNEUROSCI.4608-03.2004.

Neural stem cell detection, characterization, and age-related changes in the subventricular zone of mice

Affiliations

Neural stem cell detection, characterization, and age-related changes in the subventricular zone of mice

Alexander Y Maslov et al. J Neurosci. .

Abstract

The mammalian brain contains neural stem cells (NSCs) that allow continued neurogenesis throughout the life of the animal. However, neurogenesis is known to decline during aging and, to the extent that neurogenesis is required for normal CNS function, this may contribute to neurodegenerative disease. Decreased neurogenesis could result from loss of NSCs or dysfunction at some later step, and distinguishing these possibilities is important for understanding the cause of the decline. However, because of the inability to distinguish NSCs from their rapidly dividing progeny in situ, it has not been possible to quantitatively assess the NSC populations in young and old animals. In this report we show that the G1 phase-specific expression of the replication factor Mcm2 is a useful marker for detecting slowly cycling putative NSCs in situ and confirm the identity of these cells using both cytosine beta-D-arabinofuranoside (Ara-C) treatment and a double nucleoside analog-labeling technique. The ability to distinguish NSCs from proliferative progenitors has allowed characterization of the expression of several markers including Nestin, Musashi, and GFAP in these different cell types. Furthermore, comparison of the NSC populations in the subventricular zones of young (2-4 months) and old (24-26 months) mice demonstrates an approximately twofold reduction in the older mice. A similar twofold reduction is also observed in the number of neurospheres recovered in culture from old relative to young animals. The reduction in the neural stem cell population documented here is sufficient to account for the reduced level of neurogenesis in old animals.


Figures

Figure 1.
Figure 1.
Cells expressing Mcm2 and that failed to divide over 3 d are present within the SVZs of untreated and Ara-C-treated mice. a shows SVZs from a 4.5-month-old mouse administered IdU for 3 d in their drinking water and stained (20-22) for Mcm2 (green) and IdU (red). The majority of cells stain for both Mcm2 and IdU and appear orange. Insets in a show nuclei staining for Mcm2 only. b shows an SVZ from a mouse treated with Ara-C for 7 d, administered IdU for the final 3 d of Ara-C treatment, and stained for Mcm2 and IdU where the effect of Ara-C administration was assessed on the contralateral side from the site of cannula implantation. Arrows indicate Mcm2-positive/IdU-negative nuclei, and the asterisk indicates an Mcm2-positive/IdU-positive nucleus. c-h show the expression of Nestin (c, d), Musashi (e, f), and GFAP (g, h) in Mcm2/IdU-stained sections from 4.5-month-old mice, whereas the insets in d, f, and h show expression of these markers in Mcm2-positive cells in Ara-C-treated mice. Signals from Mcm2 (green), IdU (red), and DAPI (blue) are shown in c, e, and g, and signals from Mcm2 (green) and Nestin (red), Musashi (red) or GFAP (red) are shown in d, f, and h, respectively. Arrows in c-h indicate Mcm2+/IdU- nuclei. i and j show double staining with Nestin (green) and Musashi (red) or GFAP (green) and Musashi (red), respectively, whereas the arrow in i indicates colocalization.
Figure 2.
Figure 2.
Rapidly dividing cells and cells that failed to divide within 3 d but express Mcm2 in the SVZs of old mice. For comparison with young mice (Fig. 1a), 26-month old mice were administered IdU for 3 d and stained for both Mcm2 (green) and IdU (red). a and b are from two different regions of the same mouse and show the range of staining patterns observed. Arrows indicate Mcm2-positive, IdU-negative cells that are not associated with IdU-stained cells. The inset in b shows an Mcm2-positive, IdU-negative cell that is associated with IdU-stained cells similar to those observed in younger mice.
Figure 3.
Figure 3.
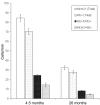
Different classes of cells detected within the SVZ decline in parallel in older mice. 4.5-month-old and 26-month-old mice were administered IdU for 3 d and injected with a pulse of 200 μl CldU solution in 0.9% saline (10 mg/ml) 2 hr before the end of the experiment (to assess the fraction of cells in S-phase). The number of total Mcm2-positive cells, total IdU-positive cells, the fraction of IdU-positive cells that also stain for CldU, and the fraction of Mcm2-positive cells that do not stain for IdU was determined.
Figure 4.
Figure 4.
A majority of long-term label retaining cells that divide again express Mcm2 in both young and old mice. a-d show controls for the specificity of antibodies. a and b are from animals labeled with both CldU and IdU, in which staining was performed as described in Materials and Methods, except that CldU primary antibody was omitted in a, and IdU primary antibody was omitted in b. c and d are from animals labeled with only CldU (c) or only IdU (d) and stained with primary antibodies against both markers. e-h compare 2-month-old (e, g) and 24-month-old (f, h) mice. Mice were administered CldU for a period of 3 weeks, removed from nucleoside label for 1 week, and administered IdU for a period of 3 weeks. SVZs from the mice where stained for Mcm2 (green in e and f and top row of insets), CldU (green in g and h and bottom insets), or IdU (red in g and h and bottom insets). Insets identify cells labeled with all three markers.
Figure 5.
Figure 5.
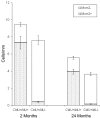
Different classes of long-term label retaining decline proportionately with age. Cells staining for CldU, IdU, and Mcm2 or combinations, from the experiment shown in Figure 4, were quantified as a function of distance in millimeters of SVZ for young and old mice. CldU-positive cells (i.e., cells that divided during the first 3 week labeling period and retained label for at least 4 additional weeks) that express IdU (i.e., divided again during the second 3 week labeling period at the end of the experiment) or do not express IdU (i.e., failed to divide during the second 3 week labeling period) are shown for both 2-month-old and 24-month-old mice. Additionally, each of these cells was scored for expression of Mcm2, and the stippled portion of the bar indicates the fraction of each class that expressed Mcm2.

References

    1. Altman J, Das GD (1965) Autoradiographic and histological evidence of postnatal hippocampal neurogenesis in rats. J Comp Neurol 124: 319-335. - PubMed
    1. Armstrong RJ, Barker RA (2001) Neurodegeneration: a failure of neuroregeneration? Lancet 358: 1174-1176. - PubMed
    1. Aten JA, Stap J, Hoebe R, Bakker PJ (1994) Application and detection of IdUrd and CldUrd as two independent cell-cycle markers. Methods Cell Biol 41: 317-326. - PubMed
    1. Bickenbach JR (1981) Identification and behavior of label-retaining cells in oral mucosa and skin. J Dent Res 60: 1611-1620. - PubMed
    1. Bickenbach JR, McCutecheon J, Mackenzie IC (1986) Rate of loss of tritiated thymidine label in basal cells in mouse epithelial tissues. Cell Tissue Kinet 19: 325-333. - PubMed

Publication types

MeSH terms