

Comment
. 2004 Mar;74(3):585-8; author reply 588-9.
doi: 10.1086/382052.
Revisiting the clinical validity of multiplex genetic testing in complex diseases
- PMID: 14973786
- PMCID: PMC1182273
- DOI: 10.1086/382052
Item in Clipboard
Comment
Revisiting the clinical validity of multiplex genetic testing in complex diseases
Am J Hum Genet.
2004 Mar.
No abstract available
Figures
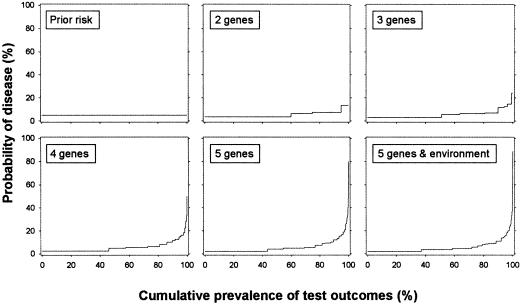
Probability of disease before and after testing for multiple genes and environmental exposure. The two-gene test has 4 (22) possible test results, the three-gene test has 8 (23) results, and so on. The posterior probability of disease for each combination of test results is obtained from the regression equations in table 1 of Yang et al. (2003).The prevalence of each combination is calculated by multiplying the probabilities of positive (p) and negative (1-p ) test results of each single test. For example, for the two-gene test we calculate that 60% ([1−0.25] × [1−0.20] × 100) of the individuals will have negative results on both tests and 15% ([1−0.25] × 0.20 × 100) will have a negative result on test 1 and a positive result on test 2. To facilitate presentation of all results, a cumulative prevalence (X-axis) was calculated, which was obtained by summing the prevalences after ranking the outcomes on their posterior probability.
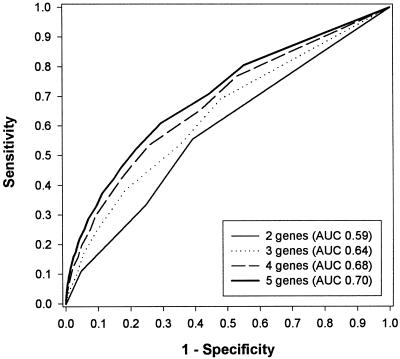
ROC curves for the multiplex genetic tests of Yang et al. (2003).
Comment on
-
Improving the prediction of complex diseases by testing for multiple disease-susceptibility genes.Am J Hum Genet. 2003 Mar;72(3):636-49. doi: 10.1086/367923. Epub 2003 Feb 14. Am J Hum Genet. 2003. PMID: 12592605 Free PMC article.
References
-
- Carney PA, Miglioretti DL, Yankaskas BC, Kerlikowske K, Rosenberg R, Rutter CM, Geller BM, Abraham LA, Taplin SH, Dignan M, Cutter G, Ballard-Barbash R (2003) Individual and combined effects of age, breast density, and hormone replacement therapy use on the accuracy of screening mammography. Ann Intern Med 138:168–175 - PubMed
-
- Hanley JA, McNeil BJ (1982) The meaning and use of the area under a receiver operating characteristic (ROC) curve. Radiology 143:29–36 - PubMed
-
- Thompson ML, Zucchini W (1989) On the statistical analysis of ROC curves. Stat Med 8:1277–1290 - PubMed
Publication types
MeSH terms
LinkOut - more resources
Full Text Sources
Medical
