

Genetic linkage analysis of longitudinal hypertension phenotypes using three summary measures
- PMID: 14975092
- PMCID: PMC1866459
- DOI: 10.1186/1471-2156-4-S1-S24
Genetic linkage analysis of longitudinal hypertension phenotypes using three summary measures
Abstract
Background: Longitudinal data often have multiple (repeated) measures recorded along a time trajectory. For example, the two cohorts from the Framingham Heart Study (GAW13 Problem 1) contain 21 and 5 repeated measures for hypertension phenotypes as well as epidemiological risk factors, respectively. Direct modelling of a large number of serially and biologically correlated traits in the context of linkage analysis can be prohibitively complex. Alternatively, we may consider using univariate transformation for linkage analysis of longitudinal repeated measures.
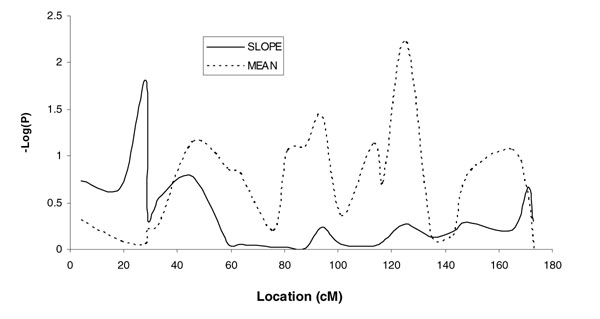
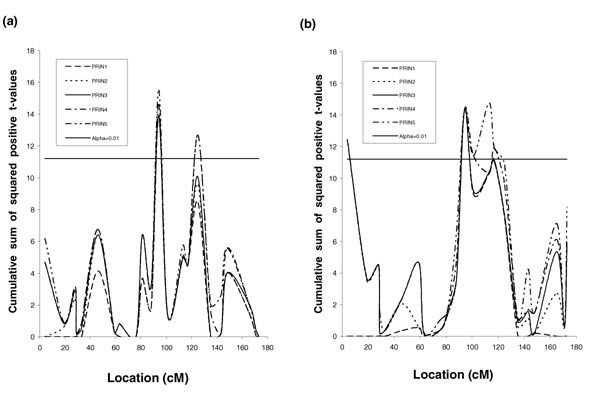
Results: We evaluated the utility of three conventional summary measures (mean, slope, and principal components) for genetic linkage analysis of longitudinal phenotypes by analyzing the chromosome 10 data of the Framingham Heart Study. Except for the temporal slope, all of the summary methods and the multivariate analysis identified the previously reported region, marker GATA64A09, for systolic blood pressure or high blood pressure. Further analysis revealed that this region may harbor gene(s) affecting human blood pressure at multiple stages of life.
Conclusion: We conclude that mean and principal components are feasible alternatives for genetic linkage analysis of longitudinal phenotypes, but the slope might have a separate genetic basis from that of the original longitudinal phenotypes.
Figures
Similar articles
-
Segregation and linkage analysis for longitudinal measurements of a quantitative trait.BMC Genet. 2003 Dec 31;4 Suppl 1(Suppl 1):S21. doi: 10.1186/1471-2156-4-S1-S21. BMC Genet. 2003. PMID: 14975089 Free PMC article.
-
Adjusting for covariates on a slippery slope: linkage analysis of change over time.BMC Genet. 2003 Dec 31;4 Suppl 1(Suppl 1):S50. doi: 10.1186/1471-2156-4-S1-S50. BMC Genet. 2003. PMID: 14975118 Free PMC article.
-
Comparison of Haseman-Elston regression analyses using single, summary, and longitudinal measures of systolic blood pressure.BMC Genet. 2003 Dec 31;4 Suppl 1(Suppl 1):S23. doi: 10.1186/1471-2156-4-S1-S23. BMC Genet. 2003. PMID: 14975091 Free PMC article.
-
Identification of genes for a complex trait: examples from hypertension.Curr Pharm Biotechnol. 2006 Feb;7(1):1-13. doi: 10.2174/138920106775789610. Curr Pharm Biotechnol. 2006. PMID: 16472129 Review.
-
Human chromosome 17 in essential hypertension.Ann Hum Genet. 2003 Mar;67(Pt 2):193-206. doi: 10.1046/j.1469-1809.2003.t01-1-00002.x. Ann Hum Genet. 2003. PMID: 12675695 Review.
Cited by
-
Segregation and linkage analysis for longitudinal measurements of a quantitative trait.BMC Genet. 2003 Dec 31;4 Suppl 1(Suppl 1):S21. doi: 10.1186/1471-2156-4-S1-S21. BMC Genet. 2003. PMID: 14975089 Free PMC article.
-
Discovery of Time-Delayed Gene Regulatory Networks based on temporal gene expression profiling.BMC Bioinformatics. 2006 Jan 18;7:26. doi: 10.1186/1471-2105-7-26. BMC Bioinformatics. 2006. PMID: 16420705 Free PMC article.
-
Quantitative trait locus analysis of longitudinal quantitative trait data in complex pedigrees.Genetics. 2005 Nov;171(3):1365-76. doi: 10.1534/genetics.105.043828. Epub 2005 Jul 14. Genetics. 2005. PMID: 16020786 Free PMC article.
References
-
- Levy D, DeStefano AL, Larson MG, O'Donnell CJ, Lifton RP, Gavras H, Cupples LA, Myers RH. Evidence for a gene influencing blood pressure on chromosome 17, genome scan linkage results for longitudinal blood pressure phenotypes in subjects from the Framingham Heart Study. Hypertension. 2000;36:477–483. - PubMed
-
- Falconer DS, Mackay TFC. London Longman. 4 1996. Introduction to Quantitative Genetics.
-
- Diggle PJ. Time Series: A Biostatistical Introduction. Oxford, Oxford University Press. 1990.
-
- Diggle PJ, Liang K-Y, Zeger SL. Analysis of Longitudinal Data. Oxford, Clarendon Press. 1994.
-
- Meyer K, Hill WG. Estimation of genetic and phenotypic covariance functions for longitudinal or 'repeated' records by restricted maximum likelihood. Livest Prod Sci. 1997;47:185–200. doi: 10.1016/S0301-6226(96)01414-5. - DOI
Publication types
MeSH terms
Substances
Grants and funding
LinkOut - more resources
Full Text Sources
Medical
