. 2004 Mar;134(3):979-94.
doi: 10.1104/pp.103.030221. Epub 2004 Feb 19.

Molecular and biochemical analysis of two cDNA clones encoding dihydroflavonol-4-reductase from Medicago truncatula

Affiliations

Molecular and biochemical analysis of two cDNA clones encoding dihydroflavonol-4-reductase from Medicago truncatula

De-Yu Xie et al. Plant Physiol. 2004 Mar.

Abstract

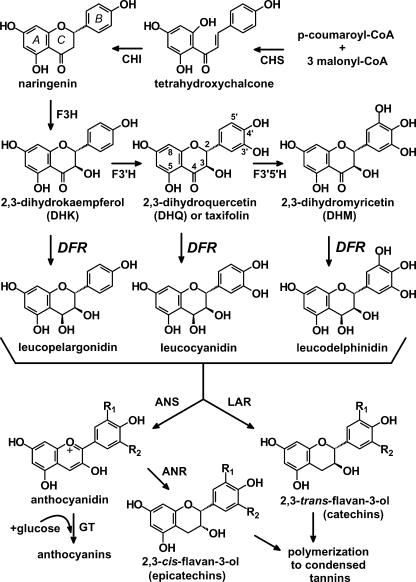
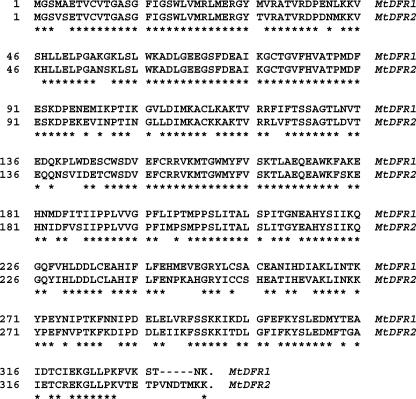
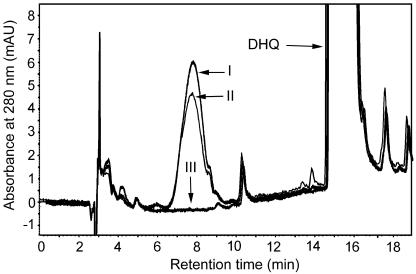
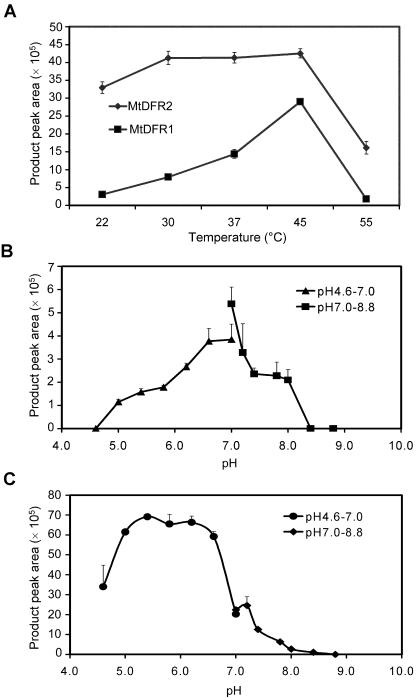
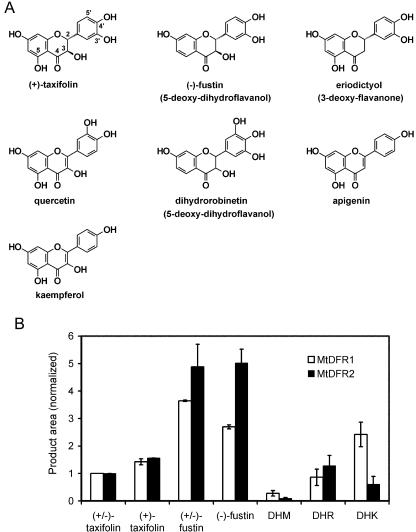
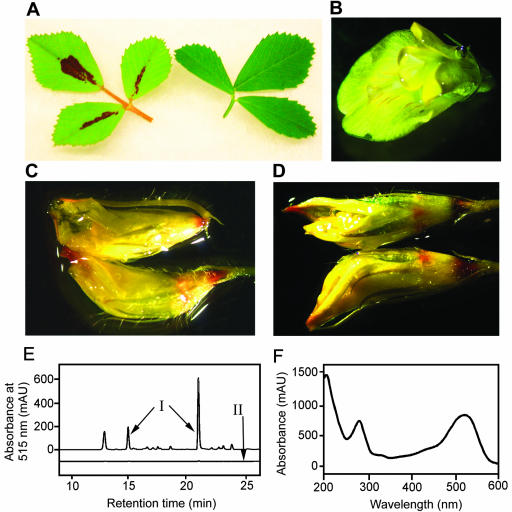
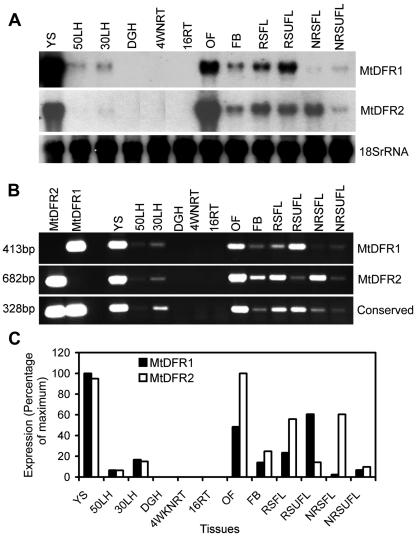
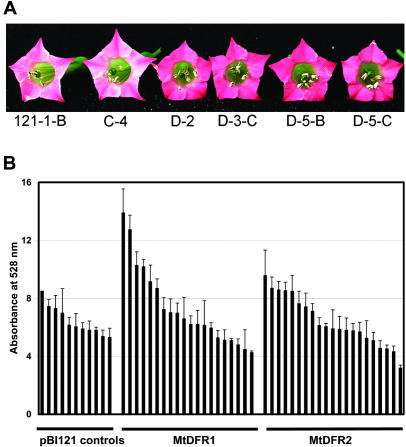
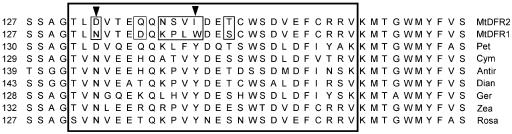
Dihydroflavonol-4-reductase (DFR; EC1.1.1.219) catalyzes a key step late in the biosynthesis of anthocyanins, condensed tannins (proanthocyanidins), and other flavonoids important to plant survival and human nutrition. Two DFR cDNA clones (MtDFR1 and MtDFR2) were isolated from the model legume Medicago truncatula cv Jemalong. Both clones were functionally expressed in Escherichia coli, confirming that both encode active DFR proteins that readily reduce taxifolin (dihydroquercetin) to leucocyanidin. M. truncatula leaf anthocyanins were shown to be cyanidin-glucoside derivatives, and the seed coat proanthocyanidins are known catechin and epicatechin derivatives, all biosynthesized from leucocyanidin. Despite high amino acid similarity (79% identical), the recombinant DFR proteins exhibited differing pH and temperature profiles and differing relative substrate preferences. Although no pelargonidin derivatives were identified in M. truncatula, MtDFR1 readily reduced dihydrokaempferol, consistent with the presence of an asparagine residue at a location known to determine substrate specificity in other DFRs, whereas MtDFR2 contained an aspartate residue at the same site and was only marginally active on dihydrokaempferol. Both recombinant DFR proteins very efficiently reduced 5-deoxydihydroflavonol substrates fustin and dihydrorobinetin, substances not previously reported as constituents of M. truncatula. Transcript accumulation for both genes was highest in young seeds and flowers, consistent with accumulation of condensed tannins and leucoanthocyanidins in these tissues. MtDFR1 transcript levels in developing leaves closely paralleled leaf anthocyanin accumulation. Overexpression of MtDFR1 in transgenic tobacco (Nicotiana tabacum) resulted in visible increases in anthocyanin accumulation in flowers, whereas MtDFR2 did not. The data reveal unexpected properties and differences in two DFR proteins from a single species.


Figures

Figure 1.
Figure 1.
Biosynthetic relationship of DFR to anthocyanidins, leucoanthocyanidins, catechins, and condensed tannins (CTs). CHI, Chalcone isomerase; F3H, (2S)-flavanone 3-hydroxylase; F3′H, flavonoid 3′-hydroxylase; F3′,5′H, flavonoid 3′,5′-hydroxylase; ANS, anthocyanidin synthase (also known as leucoanthocyanidin dioxygenase); GT, anthocyanidin glucosyl transferase; LAR, leucoanthocyanidin reductase. A to C on the naringenin structure indicate the standard nomenclature assigned to the three flavonoid rings. After 3-O-glucosylation of anthocyanidins to form anthocyanins by GT, anthocyanins may be further modified, undergoing additional glycosylation, methylation, and acylation. The pathway differs from that in recent reviews of flavonoid biosynthesis to account for the recent discovery that anthocyanin reductase (ANR or BAN) produces 2,3-cis-flavan-3-ols such as epicatechin (3′,4′ B ring hydroxylated) via the NADPH-dependent reduction of anthocyanidins, not leucoanthocyanidins (Xie et al., 2003).
Figure 2.
Figure 2.
Alignment of the amino acid sequences encoded by MtDFR1 and MtDFR2. Residues that are identical in the two sequences are marked with an asterisk.
Figure 3.
Figure 3.
Southern-blot hybridization of M. truncatula genomic DNA with MtDFR1 and MtDFR2 gene-specific probes. A, MtDFR1-specific probe (225 bp). B, MtDFR2-specific probe (173 bp). C, MtDFR1 and MtDFR2 probes combined. Lane 1, MtDFR1 cDNA insert. Lane 2, MtDFR2 cDNA insert. Genomic DNA was digested with EcoRI (E) or Hind III (H). The hybridizing bands in the EcoRI lane in C are resolvable upon extended electrophoresis.
Figure 4.
Figure 4.
HPLC chromatograms of DFR enzyme assay extracts. Assay mixtures contained (±)-taxifolin as substrate (marked DHQ), NADPH, and protein extracts from E. coli harboring pSE380-MtDFR2 (line I), pSE380-MtDFR1 (line II), or the empty expression vector pSE380 (line III). Chromatograms were recorded at the UV absorbance wavelength of 280 nm. The identity of the leucocyanidin product (early eluting peak in I and II) was confirmed based on relative retention time, UV spectra, and mass spectrum (via liquid chromatography [LC]-mass spectrometry [MS]).
Figure 5.
Figure 5.
DFR reaction velocity versus temperature and pH for MtDFR1 and MtDFR2. A, To determine the effect of temperature on the rate of product formation, enzyme assays were conducted at temperatures from 22°C to 55°C for 30 min at pH 7.0, 1 mm NADPH, and 0.66 mm (±)-taxifolin. B and C, To determine the effect of pH on the rate of product formation, enzyme assays were conducted at 30°C and the above conditions, except that for pH 4.6 to pH 7.0, citrate/phosphate buffer was substituted for Tris-HCl buffer. B, MtDFR1. C, MtDFR2.
Figure 6.
Figure 6.
Relative substrate preferences of MtDFR1 and MtDFR2. A, Structures of representative chemicals tested as substrates for MtDFR1 and MtDFR2, shown in comparison to taxifolin. Additional substrates are shown in Figure 1. B, Relative activity of MtDFR1 and MtDFR2 on selected dihydroflavonols. The enzyme activities were assayed at their respective optimum pH values (pH 7.0 for MtDFR1 and pH 6.2 for MtDFR2),2mm NADPH, and 30°C, with all substrates at a final concentration of 400 μg mL-1. [Differences in Mrs of the substrates only cause a variation of at most 10% (for DHM) in the millimolar concentrations of the substrates, and most concentrations are within ±5% of the (±)-taxifolin concentrations.] For each enzyme, product peak areas were normalized relative to the (±)-taxifolin product area to enable a comparison of the activities relative to a common substrate. Thus, the (±)-taxifolin value is set at 1.0 for both MtDFR1 and MtDFR2 proteins. All calculations assumed that molar extinction coefficients of the products were equal at 280 nm, given similar chromophores. The graph represents the average of two independent replicate experiments.
Figure 7.
Figure 7.
Anthocyanin and leucoanthocyanidin analysis in M. truncatula leaves and flowers. A, Trifoliate leaves from M. truncatula cv Jemalong line A-17 with (left) and without (right) leaf anthocyanin accumulation. Extended vernalization of young seedlings and high nitrate fertilizer levels reduce or eliminate leaf anthocyanin accumulation, whereas low nitrogen and high light levels promote anthocyanin accumulation. B, Open flower, submerged in water, as a negative staining control. Most of the flower petals are bright yellow, with very narrow streaks of red pigment visible on the standard (largest) petal. C, Flower buds treated with 6 m HCl for 2 to 3 min at room temperature. The very rapid formation of red color at the petal tips and bases is indicative of the conversion of colorless leucoanthocyanidins to anthocyanins. Under these mild conditions, color formation from CTs should require the presence of vanillin (Devic et al., 1999). D, Flower buds treated with 1% (w/v) vanillin in 6 m HCl. Red color is observed in the same regions of the buds with vanillin as without vanillin (C). Although CTs may be in these regions, their presence would be obscured by the other substances reacting with 6 m HCl. E, HPLC chromatograms of extracts from red and green portions of M. truncatula leaves. Elution was monitored at 515 nm to enhance the detection of and selectivity for red pigments. Three prominent peaks were present in acidic methanol extracts of red leaf sectors (line I), whereas these peaks were absent or greatly reduced in extracts of green sectors (line II). Chromatograms are offset by 25 milli-absorbance units to help differentiate the chromatograms. F, UV/visible diode array scan of the major anthocyanin component of M. truncatula leaves. The scan was captured as the peak eluted (at 21 min) from the HPLC in a mixture of phosphoric acid and acetonitrile. The scan is very similar to those of cyanidin in the same HPLC elution conditions (data not shown).
Figure 8.
Figure 8.
Developmental variation in DFR transcript levels in M. truncatula. A, Northern-blot hybridization analysis with different DFR probes: MtDFR1 coding region probe, MtDFR2 coding region probe, and soybean (Glycine max) 18S rRNA (loading control) probe. B, Ethidium bromide-stained agarose gel analysis of reverse transcriptase (RT)-PCR with transcript specific and general DFR primers: MtDFR1-specific primer pair, MtDFR2-specific primer pair, and conserved DFR primer pair, which amplifies both MtDFR1 and MtDFR2 transcripts. C, Normalized values of signal intensities for MtDFR1 and MtDFR2 RT-PCR products. Following quantitation of band intensities of the RT-PCR experiment, all of the numerical values for each primer set were divided by the highest value in that set, such that the tissue with highest transcript levels would be assigned 100% and the other tissue would be scored relative to this. For MtDFR1, YSs were the highest (100%), whereas for MtDFR2, open flowers were the highest, slightly higher than YSs. The analysis was repeated three times, with less than 5% variation between replicates. 50LH, 50-h Light-induced hypocotyls (with visible red epidermal anthocyanins); 30LH, 30-h light-induced hypocotyls (with visible red epidermal anthocyanins); DGH, dark-grown hypocotyls (white, with no anthocyanins); 4WNRT, 4-week-old nodulated roots (including both nodules and entire root systems); 16RT, 16-d-old roots (not inoculated with Rhizobia meliloti, and grown with 16 mm nitrate fertilizer); OF, open flowers; FB, flower buds; RSFL, red spot folded leaves; RSUFL, red spot unfolded leaves; NRSFL, non-red spot folded leaves; NRSUFL, non-red spot unfolded leaves. In M. truncatula, the younger leaflets are folded (FL, folded leaf) as they initially emerge and later unfold (UFL, unfolded leaf). If conditions allow leaf anthocyanin accumulation, the central red leaf spot will already be visible when the leaflets unfold but may darken as the leaf matures.
Figure 9.
Figure 9.
Effect of MtDFR 1 and MtDFR2 in vivo on anthocyanin accumulation in transformed tobacco flowers. A, Overexpression of MtDFR1 under the control of the cauliflower mosaic virus (CaMV) 35S promoter in transgenic tobacco flowers (lines D-2, D-3-C, D-5-B, and D-5-C) resulted in a visible increase in anthocyanin accumulation in the corolla, relative to untransformed lines (C-4) and lines harboring pBI121 (121-1-B). B, Spectroscopic quantitation of anthocyanin levels in transformed tobacco flowers. Corollas of three flowers from individual transformed tobacco plants were extracted in acidic methanol, and the absorbance of the extracts was measured at 528 nm to estimate relative anthocyanin levels. Error bars = sds of three measurements for each line. Four lines harboring MtDFR1 had significantly higher anthocyanin levels compared with the four highest pBI121 transformed lines (based on a Student's t test analysis limit of P ≤ 0.05; three lines passed at P ≤ 0.01). No lines overexpressing MtDFR2 showed significant increases in anthocyanins (based on a Student's t test analysis limit of P ≤ 0.05).
Figure 10.
Figure 10.
Alignment of M. truncatula MtDFR1 and MtDFR2 partial sequences with DFR sequences from seven other species, emphasizing the 26-amino acid region (boxed) proposed to determine substrate specificity (Beld et al., 1989; Johnson et al., 2001). Pet, Petunia; Cym, C. hybrida; Dian, Dianthus caryophyllus; Ger, G. hybrida; Zea, maize (Zea mays); Antir, snapdragon; Rosa, Rosa hybrida. The first arrow over residue 133 in MtDFR1 and MtDFR2 indicates the Asn or Asp residue that has a major impact on the utilization of DHK; MtDFR2 and petunia DFR both contain Asp residues at this site and process DHK poorly or not at all. The second arrow over residue 142 in MtDFR1 and MtDFR2 indicates the Ile or Trp residues that differ from the highly conserved Tyr residues in other DFR sequences.

Similar articles

Cited by

References

    1. Almeida J, Carpenter R, Robbins TP, Martin C, Coen ES (1989) Genetic interactions underlying flower color patterns in Antirrhinun majus. Genes Dev 3: 1758-1767 - PubMed
    1. Baggett BR, Cooper JD, Hogan ET, Carper J, Paiva NL, Smith JT (2002) Profiling isoflavonoids found in legume root extracts using capillary electrophoresis. Electrophoresis 23: 1642-1651 - PubMed
    1. Beld M, Martin C, Huits H, Stuitje AR, Gerats AG (1989) Flavonoid synthesis in Petunia hybrida: partial characterization of dihydroflavonol-4-reductase genes. Plant Mol Biol 13: 491-502 - PubMed
    1. Bell CJ, Dixon RA, Farmer AD, Flores R, Inman J, Gonzales RA, Harrison MJ, Paiva NL, Scott AD, Weller JW et al. (2001) The Medicago Genome Initiative: a model legume database. Nucleic Acids Res 29: 114-117 - PMC - PubMed
    1. Bongue-Bartelsman M, O'Neill SD, Tong Y, Yoder JI (1994) Characterization of the gene encoding dihydroflavonol 4-reductase in tomato. Gene 138: 153-157 - PubMed

Publication types

MeSH terms

LinkOut - more resources