Comparative Study
. 2003 Sep-Oct;20(5):465-80.
doi: 10.1017/s0952523803205010.

A model of high-frequency oscillatory potentials in retinal ganglion cells

Affiliations
Comparative Study

A model of high-frequency oscillatory potentials in retinal ganglion cells

Garrett T Kenyon et al. Vis Neurosci. 2003 Sep-Oct.

Abstract

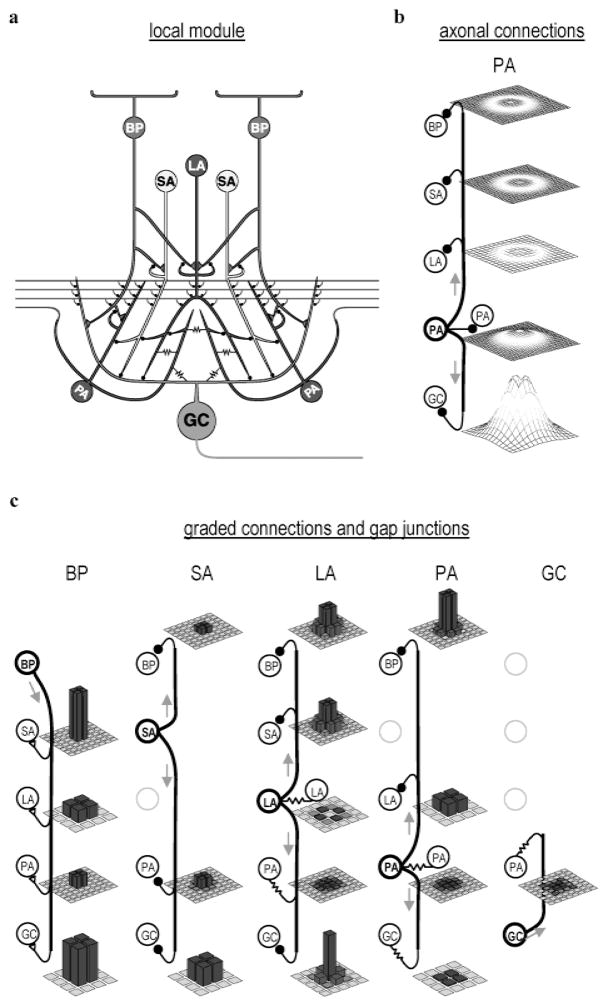
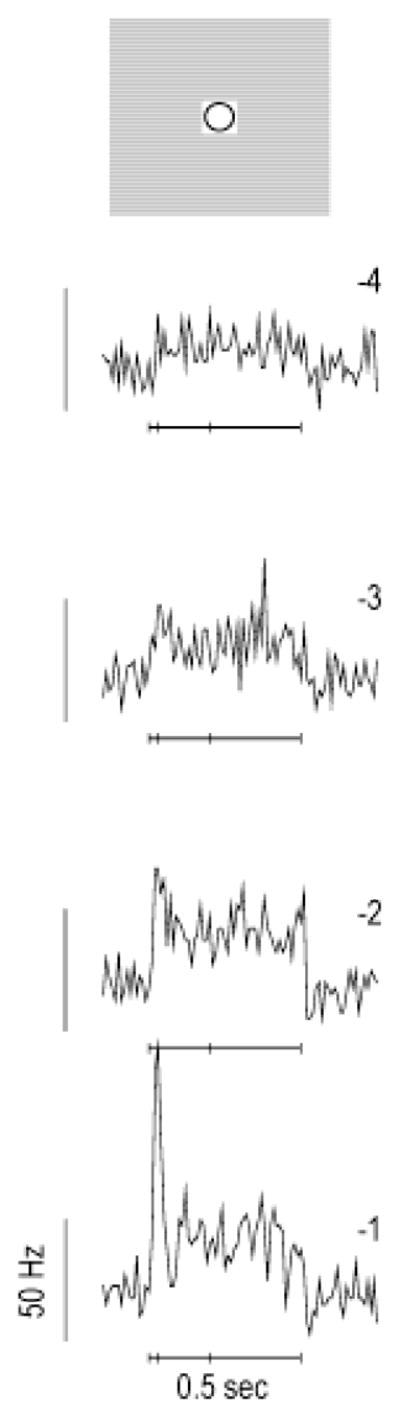
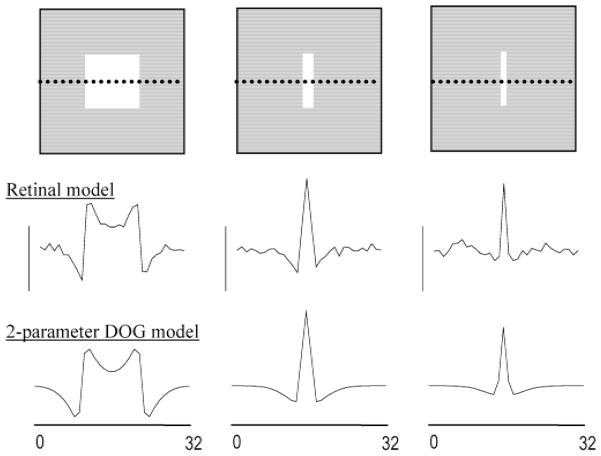
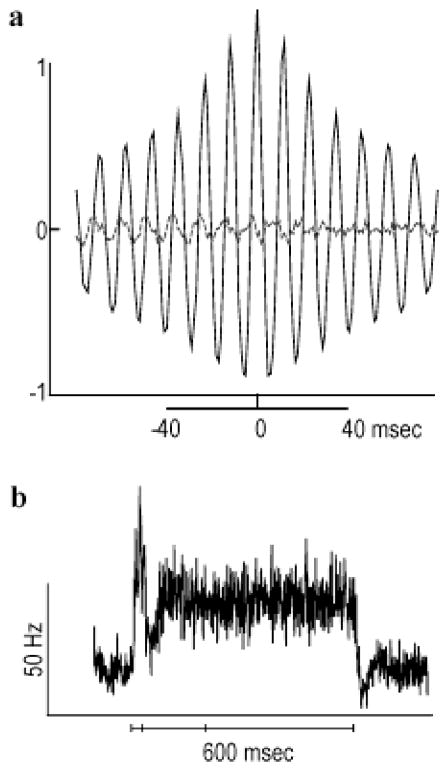
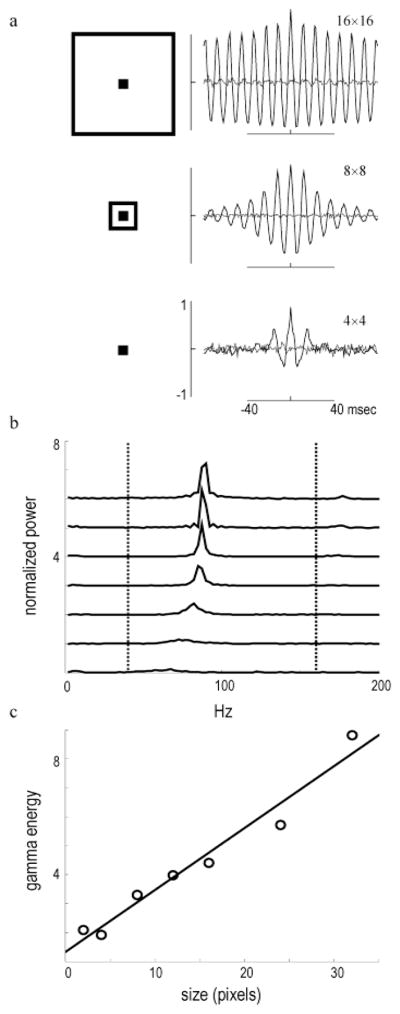
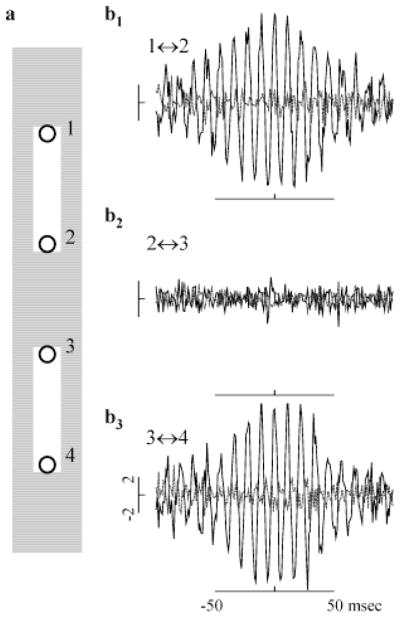
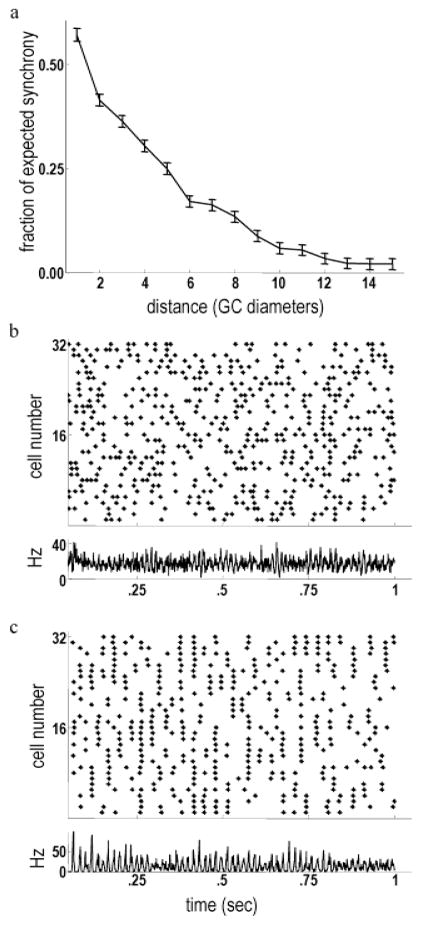
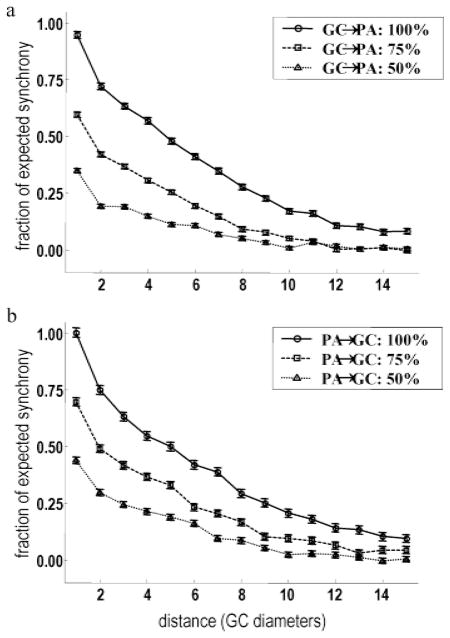
High-frequency oscillatory potentials (HFOPs) have been recorded from ganglion cells in cat, rabbit, frog, and mudpuppy retina and in electroretinograms (ERGs) from humans and other primates. However, the origin of HFOPs is unknown. Based on patterns of tracer coupling, we hypothesized that HFOPs could be generated, in part, by negative feedback from axon-bearing amacrine cells excited via electrical synapses with neighboring ganglion cells. Computer simulations were used to determine whether such axon-mediated feedback was consistent with the experimentally observed properties of HFOPs. (1) Periodic signals are typically absent from ganglion cell PSTHs, in part because the phases of retinal HFOPs vary randomly over time and are only weakly stimulus locked. In the retinal model, this phase variability resulted from the nonlinear properties of axon-mediated feedback in combination with synaptic noise. (2) HFOPs increase as a function of stimulus size up to several times the receptive-field center diameter. In the model, axon-mediated feedback pooled signals over a large retinal area, producing HFOPs that were similarly size dependent. (3) HFOPs are stimulus specific. In the model, gap junctions between neighboring neurons caused contiguous regions to become phase locked, but did not synchronize separate regions. Model-generated HFOPs were consistent with the receptive-field center dynamics and spatial organization of cat alpha cells. HFOPs did not depend qualitatively on the exact value of any model parameter or on the numerical precision of the integration method. We conclude that HFOPs could be mediated, in part, by circuitry consistent with known retinal anatomy.


Figures

Fig. 1
Fig. 1
Model used for simulating synaptic interactions in the inner retina. (a) Schematic of single processing unit, one of 32 × 32 identical processing units in the model. Input conveyed by a 2 × 2 array of bipolar cells (BPs; only 2 shown). Output conveyed by single ganglion cell (GC) axon. Each processing unit contained three different inhibitory interneuron types, implemented as local arrays containing 2 × 2 small (SA), 1 × 1 large (LA), and 2 × 2 polyaxonal (PA) amacrine cells (ACs) (not all cells are shown). All cells consisted of a single compartment, but are drawn with complex morphologies to better illustrate their synaptic interactions. Filled black circles are inhibitory synapses, triangular contacts excitatory synapses, and resistors gap junctions. (b) Spatial distribution and relative strength of PA axon mediated inhibition. Heights of mesh surfaces show spatial distribution of total synaptic input from the 2 × 2 array of PA axons arising from a single local processing module. Mesh spacing indicates density of corresponding postsynaptic cells. Same vertical scale, in arbitrary units, used in all mesh plots. (c) Spatial distribution and relative strength of short-range connections. Bar height indicates relative strength of the maximum synaptic input from the indicated presynaptic cell types, arising from a single local processing module, to the indicated postsynaptic cells types. Each bar corresponds to a single postsynaptic cell. Grid density reflects density of the postsynaptic cell population. Same vertical scale used in all bar graphs.
Fig. 2
Fig. 2
Consistency of retinal model with the receptive-field center dynamics of cat alpha ganglion cells. Illustration: A representative model ganglion cell was stimulated with a small square that activated the receptive field center out to a distance of one σ [Gaussian radius, see eqn. (5)]. Panels: Peristimulus-time histograms (PSTHs) recorded over a four-fold range of stimulus intensities ( 116-12). The stimulus intensity (log2 units) is indicated to the upper right of each PSTH. Local inhibition from nonspiking amacrine cells produced a form of contrast gain control that caused ganglion cell responses to become more transient as the stimulus intensity was increased (40 trials, 10-ms bin width). Model PSTHs were similar to those recorded from cat ganglion cells (Creutzfeldt et al., 1970).
Fig. 3
Fig. 3
Consistency of the retinal model with the center/surround organization of cat alpha ganglion cells. Top row: The retinal model was stimulated with low intensity bars of varying thickness. Middle row: Plateau firing rates of the ganglion cells along a cross section passing through the center of each bar (dotted line in top panels). Bottom row: Firing rate profile predicted by a two-parameter Difference-of-Gaussians (DOG) model in which the ratio of center-to-surround strengths and radii were fixed at published values for cat alpha cells (Troy et al., 1993).
Fig. 4
Fig. 4
HFOPs in the retinal model are not strongly stimulus locked. (a) A 6 × 6 array of model ganglion cells was stimulated by a square spot ( intensity=14). Solid black lines: Multiunit mCCHs, obtained by combining individual CCHs from all pairs of ganglion cells within a 2 × 2 window at the center of the stimulus. Correlations expressed as a fraction of the expected synchrony due to chance. Dashed gray lines: Shift predictors, obtained by recomputing the mCCHs using spike trains from different stimulus trials. Model mCCHs were similar to multiunit correlograms recorded from cat ganglion cells in response to analogous stimuli (Neuenschwander et al., 1999). (b) Multiunit mPSTH, obtained by averaging the individual PSTHs over all model ganglion cells within a 2 × 2 window at the center of the stimulus (bin width, 1 ms). The solid line at the bottom of the panel indicates the stimulus duration (600 ms). Periodic structure is mostly absent from the mPSTH since HFOPs in the retinal model were not strongly stimulus locked for spots of this size and intensity.
Fig. 5
Fig. 5
HFOPs in the retinal model are proportional to stimulus size. (a) mCCHs measured during the plateau response for a 2 × 2 array of ganglion cells centered within stimuli of increasing size (see illustrations). Stimulus size (in pixels) indicated to upper right of each mCCH. HFOPs increased sharply with stimulus size. Shift predictors were negligible. (b) Power spectra of model mCCHs for a range of spot sizes (2 × 2, 4 × 4, 6 × 6, 8 × 8, 12 × 12, 16 × 16, 24 × 24, and 32 × 32 pixels). (c) Total energy of the model HFOPs in the gamma-frequency band (40–160 Hz) increased approximately linearly with spot diameter (best fit regression line shown). Each pixel corresponded to approximately 14 of a degree in the area centralis. A similar dependence on spot size is exhibited by HFOPs between cat ganglion cells (Neuenschwander et al., 1999).
Fig. 6
Fig. 6
HFOPs in the retinal model are stimulus specific. (a) Location of stimuli (white rectangles) relative to the receptive-field centers of recorded ganglion cells, labeled 1–4 (circles). (b1–b3) CCHs (solid black lines) and associated shift predictors (dashed gray lines) computed during the plateau portion of the response for pairs of ganglion cells at opposite ends of the same bar or at opposing tips of separate bars. Correlations expressed as a fraction of the baseline synchrony. All ganglion cell pairs were separated by seven GC receptive-field diameters. (b1) pair 1 ↔ 2 from upper bar; (b2) pair 2 ↔ 3 from separate bars; (b3) pair 3 ↔ 4 from lower bar. Correlations were only significant between pairs from the same bar, as with HFOPs between cat ganglion cells (Neuenschwander et al., 1996).
Fig. 7
Fig. 7
Background firing correlations declined as a function of increasing center-to-center distance. (a) Synchrony (mCCH peak relative to baseline, averaged over all GC pairs) of model ganglion cells as a function of center-to-center distance. Synchrony declined rapidly with increasing separation. A similar decline with increasing center-to-center separation is exhibited by the background correlations between cat alpha cells (Mastronarde, 1983). (b) Top: Raster plot showing the spontaneous firing activity of a line of ganglion cells stretching across the model retina. Bottom: Instantaneous firing rate of all ganglion cells. Background gamma-band oscillations are evident, as in physiological data (Neuenschwander et al., 1999). (c) Top: Raster plot of ganglion cell activity after reducing synaptic weights by 95%. Long-range synchrony mediated by gap junctions is clearly apparent. Bottom: The instantaneous firing rate of all ganglion cells shows very strong synchronization. Blocking synaptic transmission produces qualitatively similar effects in salamander retina (Brivanlou et al., 1998).
Fig. 8
Fig. 8
HFOPs in the retinal model depend on gap junction-mediated excitation and axon-mediated inhibition. (a,b) Applying a weak full-field stimulus (intensity = 1/16) approximately doubled the level of synchrony between ganglion cell pairs at all separations relative to spontaneous levels (solid line, circles). (a) The increase in long-range synchrony produced by full-field stimulation could be reversed by reducing the coupling strength of the gap junctions from ganglion cells to axon-bearing amacrine cells by 25% (dashed line, squares). Reducing this coupling by 50% (dotted line, triangles) produced levels of long-range synchrony that were significantly below background. (b) Reducing axon-mediated inhibition of the ganglion cells by 25% (dashed line, squares) reduced the long-range synchrony evoked by full-field stimulation to near background levels. Reducing this axon-mediated inhibition by 50% (dotted line, triangles) reduced long-range synchrony to below background levels.
Fig. 9
Fig. 9
HFOPs in the retinal model increase with average axonal delay. Total energy in the gamma-frequency band (40–160 Hz) is plotted either as a function of axonal conduction velocity (solid lines), or for different values of a fixed axonal conduction delay (fixed delay = 1, thin line, short dashes; fixed delay = 2, intermediate thickness and dash length; mixed delay, fixed delay = 1 for PA ↔ PA connections, 2 for all other axonal connections, thickest line, longest dashes). Total gamma power expressed as a fraction of the baseline value obtained with the canonical model parameters (mixed delay). In response to a constant stimulus centered over the recorded ganglion cells (size = 8 × 8 GC diameters, intensity=12, solid lines), total power in the gamma-frequency band during the plateau portion of the response declined as the average conduction delay was reduced. A similar effect was seen during background activity (lower set of curves). All connections had a minimum fixed delay of 1 ms.
Fig. 10
Fig. 10
Synaptic interactions mediated by nonspiking amacrine cell increased the dynamic range of model ganglion cell responses. The fractional change in the firing rate of a representative ganglion cell during the plateau portion of the response, relative to baseline, is plotted as a function of stimulus intensity. Solid line: Standard parameters. (a) Dashed line: The gain of the negative feedback loop: PA → LA → SA → PA (see Fig. 1 for abbreviations), was reduced by decreasing the weight of each synapse by a factor of 4. At higher stimulus intensities, reduced serial inhibition between amacrine cells caused ganglion cell plateau responses to be suppressed. (b) Dashed line: Inhibitory feedback from amacrine cell dendrites onto bipolar cells was reduced by a factor of 4. Reduced feedback onto bipolar cells caused ganglion cell responses to saturate more quickly as a function of stimulus intensity. (40 trials, 10-ms bin width. Plateau period: 200–600 ms after onset.)
Fig. 11
Fig. 11
HFOPs in the retinal model were robust to changes in individual model parameters. Each parameter in the model was separately modified by ±10% or ±20% and the strength of HFOPs assessed by measuring the total power in the gamma-frequency band. Results expressed as a fraction of the baseline energy in the gamma band obtained with the standard model parameters. Four modified values are plotted for each canonical parameter value. Cellular parameters (Table 1) indicated by diamonds, synaptic parameters (Table 2) by circles. (a) Robustness of baseline activity. In the absence of stimulation, changing individual parameter values by the amount indicated did not generally cause the total energy in the gamma-frequency band to change by more than three standard deviations from the baseline value obtained with the standard parameters (solid line, mean; dashed lines, 3 S.D.; 10 trials) and in all cases remained within 25% of the mean of the standard value. (b) Robustness of stimulated activity. During stimulation by a large spot (size = 8 × 8 GC diameters, intensity=12), in only a few cases did parameter changes of ±10% produce a decrease in total gamma band energy that was more than three standard deviations (dashed lines) below the mean obtained with the canonical parameter values (solid line). Reducing certain parameter values by −20% produced significant reductions in gamma activity, but in no case did total power fall within the range of baseline activity. These results show that HFOPs, while sensitive to certain model parameters, are not critically dependent on the precise value of any one parameter.
Fig. 12
Fig. 12
Dependence of HFOPs on integration step size. (a1–2) mCCHs, combining data from all distinct cell pairs stimulated by a square spot covering an 8 × 8 array of ganglion cells (intensity = 0.5, 10 trials). (a1) Standard model and integration parameters. (a2) The integration time step was reduced to 0.01 ms and all axonal delays set equal to 2.5 ms. HFOPs were very similar to those obtained with the standard time step and axonal delays, showing that model behavior is independent of step size to within a simple change of parameters. (b1–2) mPSTHs, computed from the same data as the corresponding mCCH to the left, were mostly unaffected by step size. (c) Model behavior vs. step size. The plateau firing rate (squares), synchrony (circles), and total gamma power (diamonds) reach asymptote for step sizes below approximately 0.25 ms, consistent with the 1-ms rise time of both post-synaptic potentials and artificial spikes in the model.

Similar articles

Cited by

References

    1. Alonso JM, Usrey WM, Reid RC. Precisely correlated firing in cells of the lateral geniculate nucleus. Nature. 1996;383(6603):815–819. - PubMed
    1. Amthor FR, Grzywacz NM. Synchronous firing is stimulus dependent in directionally selective (DS) and non-DS rabbit ganglion cells. Investigative Ophthalmology & Visual Science. 2001;42(4):S677.
    1. Ariel M, Daw NW, Rader RK. Rhythmicity in rabbit retinal ganglion cell responses. Vision Research. 1983;23(12):1485–1493. - PubMed
    1. Boycott BB, Wässle H. The morphological types of ganglion cells of the domestic cat’s retina. Journal of Physiology. 1974;240(2):397–419. - PMC - PubMed
    1. Brivanlou IH, Warland DK, Meister M. Mechanisms of concerted firing among retinal ganglion cells. Neuron. 1998;20(3):527–539. - PubMed

Publication types