d24-hour changes in circulating prolactin, follicle-stimulating hormone, luteinizing hormone and testosterone in male rats subjected to social isolation
- PMID: 14977425
- PMCID: PMC373458
- DOI: 10.1186/1740-3391-2-1
d24-hour changes in circulating prolactin, follicle-stimulating hormone, luteinizing hormone and testosterone in male rats subjected to social isolation
Abstract
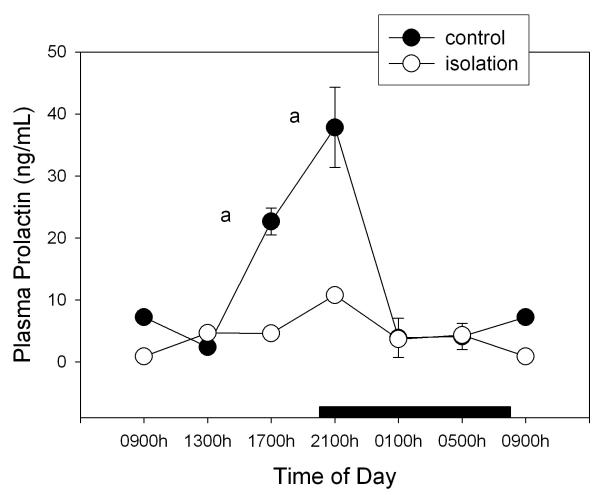
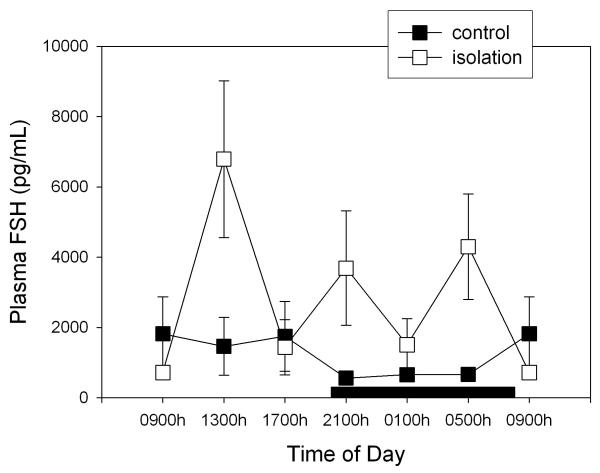
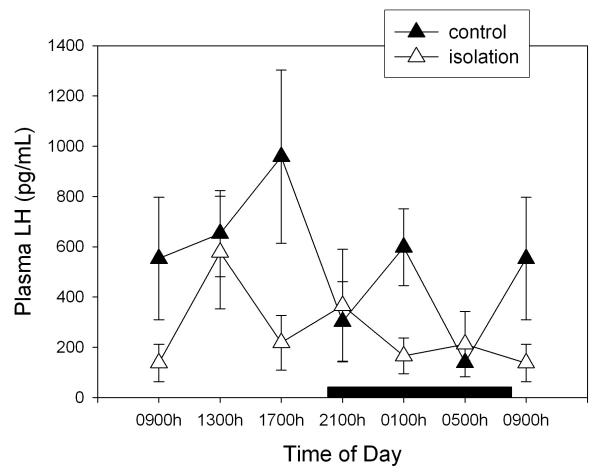
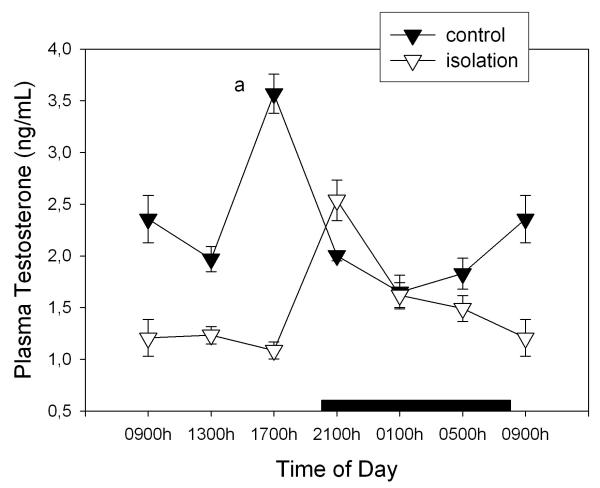
BACKGROUND: This work analyzes the effect of social isolation (a mild stressor) on the 24-h variation of pituitary-testicular function in young Wistar rats, assessed by measuring circulating levels of prolactin, FSH, LH and testosterone. METHODS: Animals were either individually caged or kept in groups (4-5 animals per cage) under a 12:12 h light-dark cycle (lights on at 0800 h) for 30 days starting on day 35 of life. Rats were killed at 4-h intervals during a 24-h cycle, beginning at 0900 h. RESULTS: Isolation brought about a decrease in prolactin, LH and testosterone secretion and an increase of FSH secretion. In isolated rats the 24-h secretory pattern of prolactin and testosterone became modified, i.e., the maximum in prolactin seen in control animals at the beginning of the activity span was no longer detected, whereas the maximum in circulating testosterone taking place at 1700 h in controls was phase-delayed to 2100 h in isolated rats. CONCLUSION: Social isolation affects the 24-h variation of pituitary-testicular function in young rats. Secretion of prolactin, LH and testosterone decreases, and secretion of FSH increases, in isolated rats. The maximum in prolactin seen in group-caged rats at the beginning of the activity span is not observed in isolated rats. The maximum in circulating testosterone taking place at the second part of the rest span in controls is phase-delayed to the light-dark transition in isolated rats.
Figures
Similar articles
-
24-hour changes in circulating prolactin, follicle-stimulating hormone, luteinizing hormone, and testosterone in young male rats subjected to calorie restriction.Chronobiol Int. 2004 May;21(3):393-404. doi: 10.1081/cbi-120038607. Chronobiol Int. 2004. PMID: 15332445
-
Effect of ethanol on 24-hour hormonal changes in peripubertal male rats.Alcohol. 2004 Oct-Nov;34(2-3):127-32. doi: 10.1016/j.alcohol.2004.06.010. Alcohol. 2004. PMID: 15902906
-
Age-dependent effect of Freund's adjuvant on 24-hour rhythms in plasma prolactin, growth hormone, thyrotropin, insulin, follicle-stimulating hormone, luteinizing hormone and testosterone in rats.Life Sci. 2000 Apr 7;66(20):1969-77. doi: 10.1016/s0024-3205(00)00522-1. Life Sci. 2000. PMID: 10821121
-
Endocrinology of male infertility.Br Med Bull. 1979 May;35(2):187-92. doi: 10.1093/oxfordjournals.bmb.a071568. Br Med Bull. 1979. PMID: 387166 Review.
-
Gonadotrophic control of follicular development and function during the oestrous cycle of the ewe.J Reprod Fertil Suppl. 1981;30:119-33. J Reprod Fertil Suppl. 1981. PMID: 6300383 Review.
Cited by
-
24-hour pattern of circulating prolactin and growth hormone levels and submaxillary lymph node immune responses in growing male rats subjected to social isolation.Endocrine. 2004 Oct;25(1):41-8. doi: 10.1385/ENDO:25:1:41. Endocrine. 2004. PMID: 15545705
-
Prolactin daily rhythm in suckling male rabbits.J Circadian Rhythms. 2005 Jan 13;3(1):1. doi: 10.1186/1740-3391-3-1. J Circadian Rhythms. 2005. PMID: 15649326 Free PMC article.
-
Practical solutions for including sex as a biological variable (SABV) in preclinical neuropsychopharmacological research.J Neurosci Methods. 2024 Jan 1;401:110003. doi: 10.1016/j.jneumeth.2023.110003. Epub 2023 Oct 31. J Neurosci Methods. 2024. PMID: 37918446 Free PMC article. Review.
-
Prenatal and postnatal challenges affect the hypothalamic molecular pathways that regulate hormonal levels.PLoS One. 2023 Oct 18;18(10):e0292952. doi: 10.1371/journal.pone.0292952. eCollection 2023. PLoS One. 2023. PMID: 37851674 Free PMC article.
-
A time for sex: circadian regulation of mammalian sexual and reproductive function.Front Neurosci. 2025 Jan 6;18:1516767. doi: 10.3389/fnins.2024.1516767. eCollection 2024. Front Neurosci. 2025. PMID: 39834701 Free PMC article. Review.
References
LinkOut - more resources
Full Text Sources