. 2004 Mar;72(3):1450-62.
doi: 10.1128/IAI.72.3.1450-1462.2004.

Bordetella pertussis infection of primary human monocytes alters HLA-DR expression

Affiliations

Bordetella pertussis infection of primary human monocytes alters HLA-DR expression

Jennifer A Shumilla et al. Infect Immun. 2004 Mar.

Abstract

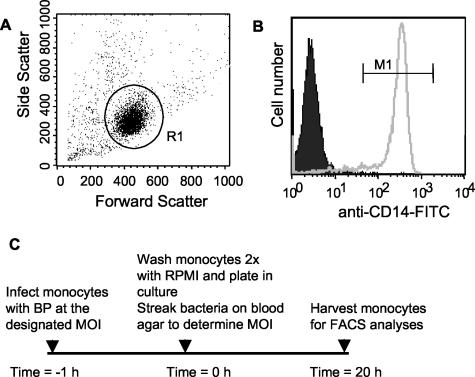
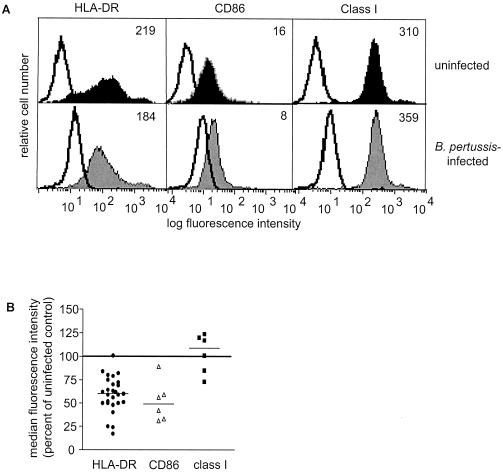
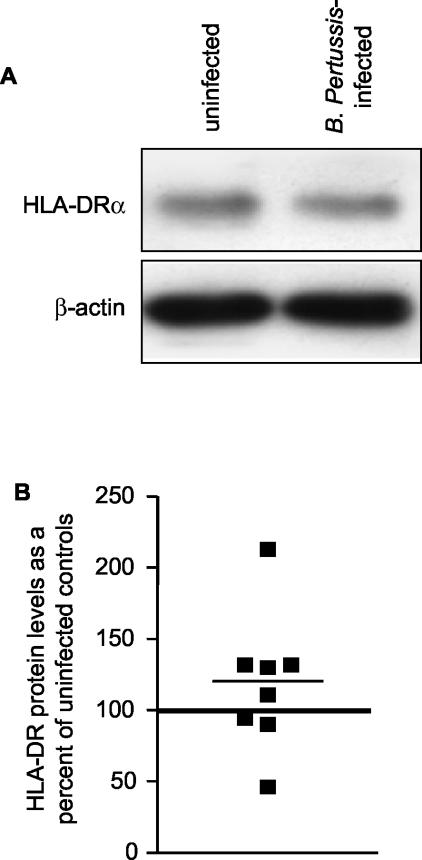
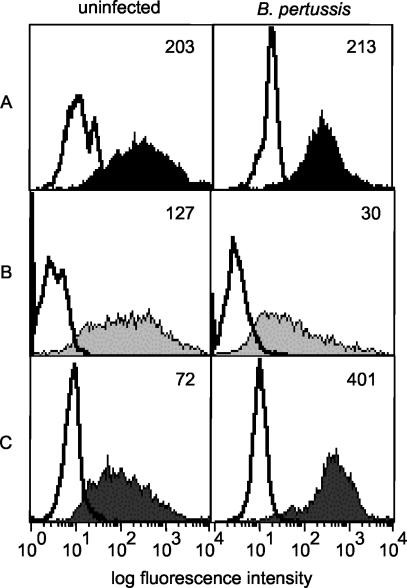
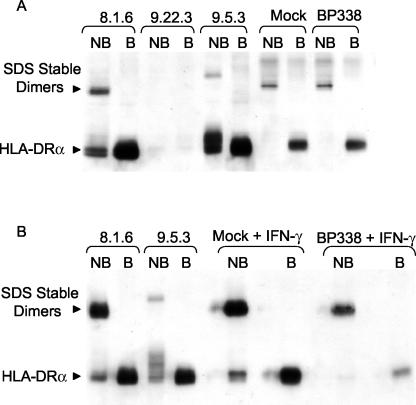
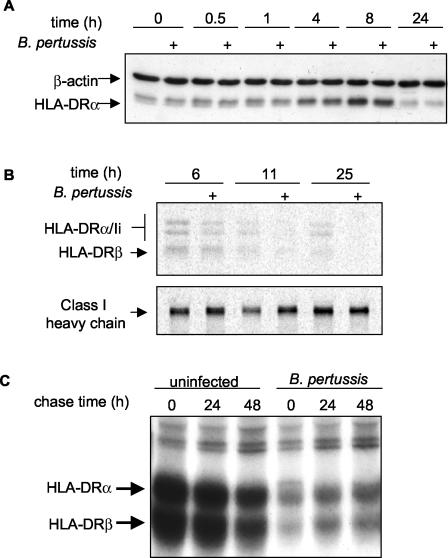
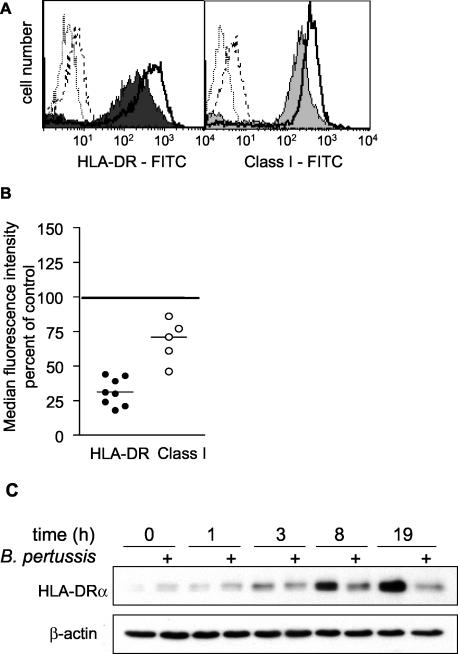
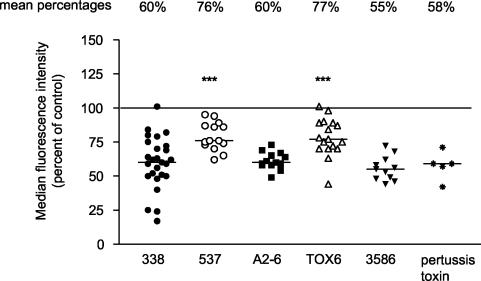
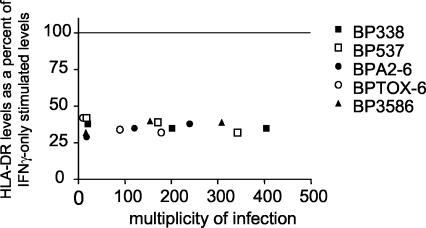
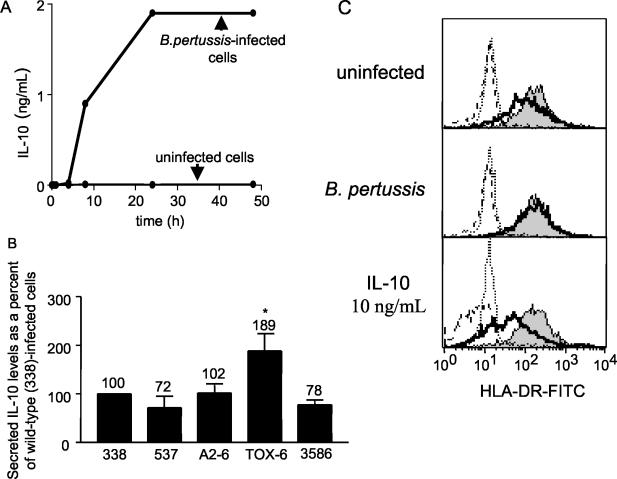
Bordetella pertussis is the causative agent of whooping cough, a potentially lethal respiratory disease in children. In immunocompetent individuals, B. pertussis infection elicits an effective adaptive immune response driven by activated CD4(+) T cells. However, live B. pertussis persists in the host for 3 to 4 weeks prior to clearance. Thus, B. pertussis appears to have evolved short-term mechanisms for immune system evasion. We investigated the effects of B. pertussis wild-type strain BP338 on antigen presentation in primary human monocytes. BP338 infection reduced cell surface expression of HLA-DR and CD86 but not that of major histocompatibility complex class I proteins. This change in cell surface HLA-DR expression reflected intracellular redistribution of HLA-DR. The proportion of peptide-loaded molecules was unchanged in infected cells, suggesting that intracellular retention occurred after peptide loading. Although B. pertussis infection of monocytes induced rapid and robust expression of interleukin-10 (IL-10), HLA-DR redistribution did not appear to be explained by increased IL-10 levels. BP338-infected monocytes exhibited reduced synthesis of HLA-DR dimers. Interestingly, those HLA-DR proteins that were generated appeared to be longer-lived than HLA-DR in uninfected monocytes. BP338 infection also prevented gamma interferon (IFN-gamma) induction of HLA-DR protein synthesis. Using mutant strains of B. pertussis, we found that reduction in HLA-DR surface expression was due in part to the presence of pertussis toxin whereas the inhibition of IFN-gamma induction of HLA-DR could not be linked to any of the virulence factors tested. These data demonstrate that B. pertussis utilizes several mechanisms to modulate HLA-DR expression.


Figures

FIG. 1.
FIG. 1.
Analysis of monocyte purity and experimental protocol. The purity of the cells obtained using a Milteny Biotec monocyte isolation kit was assessed by flow cytometry. (A) Forward- versus side-scatter analysis. Monocytes (gate = R1) constituted 81% of the total purified cells, as shown by forward- versus side-scatter analysis. (B) Representative staining of gated, purified (gate = R1) cells with anti-CD14-FITC (open histogram) or an isotype control (shaded histogram). (C) Monocyte treatment protocol.
FIG. 2.
FIG. 2.
Effects of B. pertussis on cell surface HLA-DR, CD86, and class I expression. (A) Cell surface expression of HLA-DR, CD86, and MHC class I on uninfected (top panels) and infected (bottom panels) monocytes. Shaded and closed histograms represent antigen-specific staining results. Open histograms represent the respective isotype controls. Numbers reflect median fluorescence intensity values of HLA-DR-FITC-, CD86-FITC-, or MHC class I-FITC-stained cells minus the median fluorescence intensity values of the respective isotype controls. (B) Summary scattergram of cell surface staining experiments. Symbols represent the percentages of cell surface expression in infected monocytes (individual symbols) compared to the results seen with uninfected cells (set at 100% and represented by the horizontal line) within each experiment, as calculated using median fluorescence intensity values. The mean percentage of expression of HLA-DR in infected cells compared to the results seen with uninfected controls was 71% (lower and upper confidence intervals, 64 and 78% [P < 0.001]). The mean percentage of expression of CD86 compared to the results seen with uninfected controls was 52% (lower and upper confidence intervals, 29 and 74% [P < 0.001]). The mean percentage of expression of MHC class I compared to the results seen with uninfected controls was 109% (lower and upper confidence intervals, 89 and 130% [P > 0.05]). The observed variability was not MOI dependent or donor dependent. Each experimental point represents monocytes harvested from at least two individuals.
FIG. 3.
FIG. 3.
Analysis of total cellular HLA-DR protein levels in B. pertussis-infected monocytes. (A) Representative Western blot showing levels of expression of HLA-DR and β-actin in infected and uninfected monocytes. (B) Scattergram representation of densitometric analysis of HLA-DR protein levels normalized to β-actin levels. Individual symbols represent HLA-DR levels in infected monocytes and are shown as percentages of levels in uninfected cells within each experiment (represented by the horizontal line set at 100%). HLA-DR and β-actin band intensities were within the linear range of the densitometer gray scale. The mean percentage of expression of HLA-DR in infected monocytes compared to the results seen with uninfected monocytes was 119% (lower and upper confidence intervals, 78 and 159% [P > 0.05]).
FIG. 4.
FIG. 4.
Cellular redistribution of HLA-DR molecules in uninfected and B. pertussis-infected monocytes. (A) Total cellular HLA-DR. Uninfected and infected monocytes were stained with FITC-conjugated anti-HLA-DR antibody, permeabilized, and restained with FITC-conjugated anti-HLA-DR antibody. (B) Cell surface HLA-DR. Unpermeabilized uninfected and infected monocytes were stained with FITC-conjugated anti-HLA-DR antibody. (C) Intracellular HLA-DR. Unpermeabilized monocytes were stained with FITC-conjugated anti-HLA-DR antibody and then permeabilized and restained with PE-conjugated anti-HLA-DR antibody. Bottom panel histograms represent PE-conjugated anti-HLA-DR antibody staining. For all panels, shaded and closed histograms represent HLA-DR-specific staining and open histograms represent isotype control staining. Unpermeabilized cells that were surface stained with HLA-DR-FITC and then restained with HLA-DR-PE did not exhibit significant levels of HLA-DR-PE staining (not shown). Numbers represent median fluorescence intensity levels. Data are representative of three independent experiments with comparable results.
FIG. 5.
FIG. 5.
Analysis of B. pertussis effects on HLA-DR dimer formation. (A) HLA-DR dimers from nonboiled (NB) and boiled (B) protein samples harvested from 8.1.6 (wild-type), 9.22.3 (DRα-negative), and 9.5.3 (DM-negative) cells, mock-infected monocytes, and monocytes infected with B. pertussis for 24 h. (B) HLA-DR dimers from nonboiled and boiled protein samples harvested from 8.1.6, 9.5.3, and IFN-γ-stimulated mock-infected monocytes and B. pertussis-infected monocytes. The results are representative of five independent experiments, all showing that the majority of HLA-DR dimers in mock-treated and B. pertussis-treated monocytes are SDS stable.
FIG. 6.
FIG. 6.
Effects of B. pertussis on HLA-DR steady-state levels, synthesis, and degradation. (A) Representative time course showing levels of expression of HLA-DR and β-actin in B. pertussis-infected (+) and uninfected monocytes. (B) Pulse-chase analysis of HLA-DR and MHC class I synthesis. Time values represent times after 1 h of B. pertussis infection. (C) Pulse-chase analysis of HLA-DR degradation. Time 0 represents HLA-DR levels at 24 h after 1 h of B. pertussis infection. Reductions in synthesis levels and increases in half-life were observed in two independent experiments.
FIG. 7.
FIG. 7.
B. pertussis effects on IFN-γ-stimulated HLA-DR expression. (A) Representative histogram of cell surface HLA-DR and MHC class I expression on uninfected or infected monocytes grown in cultures in the presence of 10 U of IFN-γ/ml. Shaded histograms represent antigen-specific staining of infected monocytes. Open histograms represent antigen-specific staining of uninfected monocytes. Dotted and dashed peaks represent isotype control staining on uninfected and infected monocytes, respectively. (B) Summary scattergram of cell surface staining experiments. Individual symbols represent the percentages of cell surface expression in infected monocytes compared to the results seen with IFN-γ-treated, uninfected cells within each experiment and were calculated using median fluorescence intensity values. Staining of IFN-γ-treated, uninfected cells was set at 100% and is represented by the horizontal line. The mean percentage of expression of HLA-DR in IFN-γ-stimulated infected monocytes compared to the results seen with IFN-γ-stimulated uninfected monocytes was 31% (lower and upper confidence intervals, 23 and 40% [P < 0.001]). The mean percentage of expression of MHC class I in IFN-γ-stimulated infected monocytes compared to the results seen with IFN-γ-stimulated uninfected monocytes was 68% (lower and upper confidence intervals, 49 and 87% [P < 0.001]). (C) Representative time course of total cellular HLA-DR in uninfected and B. pertussis-infected (+) monocytes grown in cultures in the presence of 10 U of IFN-γ/ml. Results from the time course were confirmed in two independent experiments, and the results seen at the latest time point (19 h) were confirmed in three additional experiments.
FIG. 8.
FIG. 8.
Effects of B. pertussis mutant strains on cell surface HLA-DR levels. Cell surface HLA-DR levels at 20 h postinfection in monocytes infected with B. pertussis wild-type strain BP338 or mutant strain BPTOX-6, BPA2-6, BP3586, or BP537 are shown. Some monocytes were treated with 100 ng of purified pertussis toxin/ml. Individual symbols represent the median fluorescence intensity levels (as determined by flow cytometry) of infected monocytes and are displayed as percentages of the results seen with the uninfected control within each experiment (uninfected control = 100% [designated by the horizontal line]). Lower and upper confidence intervals for strains are as follows: BP338, 52 and 67%; BP537, 73 and 85%; BPA2-6, 57 and 65%; BPTOX-6, 71 and 85%; BP3586, 50 and 62%; pertussis toxin, 41 and 67%. Data are representative of at least five independent experiments. ***, significance (P < 0.001) with respect to the results seen with BP338 (wild-type strain of B. pertussis).
FIG. 9.
FIG. 9.
Effects of wild-type and mutant B. pertussis strains on IFN-γ-stimulated HLA-DR expression. Monocytes were infected for 1 h with strain BP338, BPTOX-6, BPA2-6, BP3586, or BP537 and then grown in cultures in the presence of IFN-γ for an additional 20 h. Individual symbols represent the median fluorescence intensity levels of infected monocytes stimulated with IFN-γ (the levels are presented as percentages of the values seen with the uninfected, IFN-γ-stimulated control within each experiment). In one experiment, cells were infected with various mutant MOIs.
FIG. 10.
FIG. 10.
IL-10 secretion from wild-type and mutant B. pertussis-infected monocytes. (A) Time course of secreted IL-10 levels from uninfected or strain BP338-infected monocytes. (B) Secreted IL-10 levels from BP338, BP537, BPA2-6, BPTOX-6, and BP3586-infected monocytes. Data are representative of three independent experiments. Numbers above error bars indicate levels of secreted IL-10 as percentages of the levels seen with BP338-infected cells (set at 100%). *, significance (P < 0.05) with respect to the results seen with the BP338 wild-type strain. (C) Total cellular levels of HLA-DR in BP338-infected monocytes in the presence and absence of chloroquine. Solid lines represent HLA-DR levels in the absence of chloroquine. Shaded histograms represent HLA-DR levels in chloroquine-treated cells. Dotted and dashed peaks represent the isotype controls for chloroquine-treated and non-chloroquine-treated cells, respectively. Data are representative of three independent experiments (all with comparable results).

Similar articles

Cited by

References

    1. Accola, R. S. 1983. Human B cell variants immunoselected against a single Ia antigen subset have lost expression of several Ia antigen subsets. J. Exp. Med. 157:1053-1058. - PMC - PubMed
    1. Arunachalam, B., M. Pan, and P. Cresswell. 1998. Intracellular formation and cell surface expression of a complex of an intact lysosomal protein and MHC class II molecules. J. Immunol. 160:5797-5806. - PubMed
    1. Arunachalam, B., U. T. Phan, H. J. Geuze, and P. Cresswell. 2000. Enzymatic reduction of disulfide bonds in lysosomes: Characterization of a gamma-interferon-inducible lysosomal thiol reductase. Proc. Natl. Acad. Sci. USA 97:745-750. - PMC - PubMed
    1. Bakke, O., and T. W. Nordeng. 1999. Intracellular traffic to compartments for MHC class II peptide loading: signals for endosomal and polarized sorting. Immunol. Rev. 172:171-187. - PubMed
    1. Barcova, M., C. Speth, L. Kacani, F. Ubrall, H. Stoiber, and M. P. Dierich. 1999. Involvement of adenylate cyclase and p70S6-kinase activation in IL-10 up-regulation in human monocytes by gp41 envelope protein of human immunodeficiency virus type 1. Pflueg. Arch. Eur. J. Physiol. 437:538-546. - PubMed

Publication types