Comparative Study
. 2004 Mar;13(3):773-85.
doi: 10.1110/ps.03328504.

Sensitivity and selectivity in protein structure comparison

Affiliations
Comparative Study

Sensitivity and selectivity in protein structure comparison

Michael L Sierk et al. Protein Sci. 2004 Mar.

Abstract

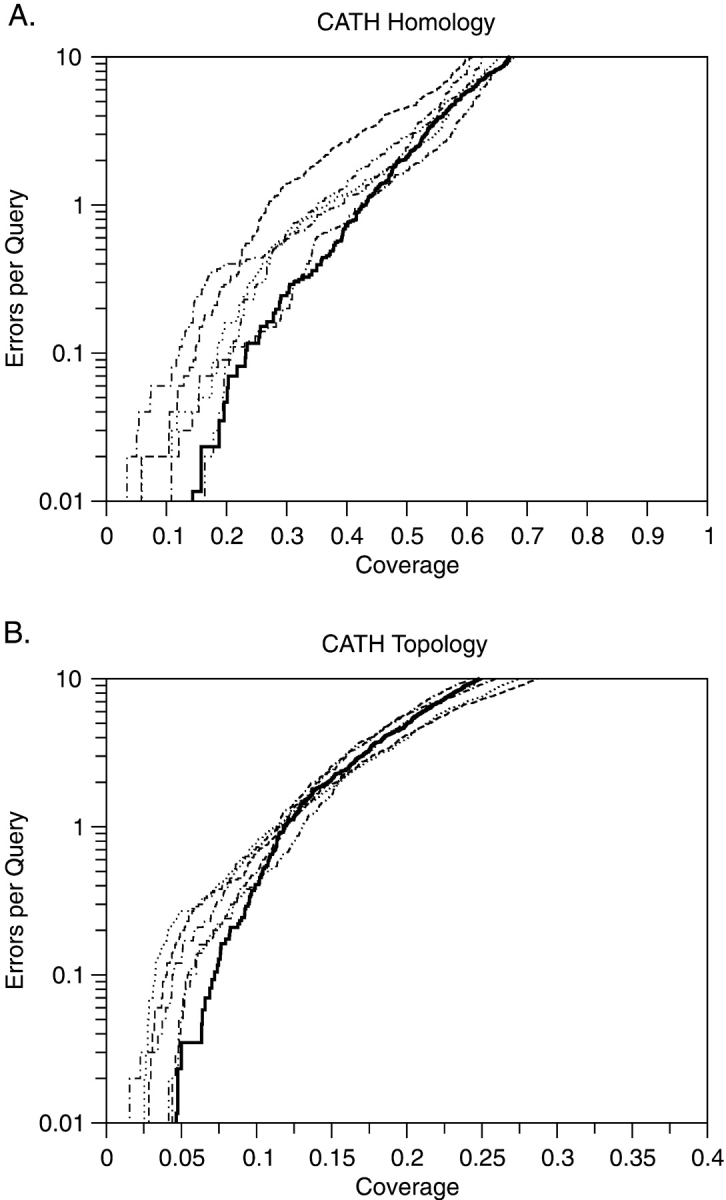
Seven protein structure comparison methods and two sequence comparison programs were evaluated on their ability to detect either protein homologs or domains with the same topology (fold) as defined by the CATH structure database. The structure alignment programs Dali, Structal, Combinatorial Extension (CE), VAST, and Matras were tested along with SGM and PRIDE, which calculate a structural distance between two domains without aligning them. We also tested two sequence alignment programs, SSEARCH and PSI-BLAST. Depending upon the level of selectivity and error model, structure alignment programs can detect roughly twice as many homologous domains in CATH as sequence alignment programs. Dali finds the most homologs, 321-533 of 1120 possible true positives (28.7%-45.7%), at an error rate of 0.1 errors per query (EPQ), whereas PSI-BLAST finds 365 true positives (32.6%), regardless of the error model. At an EPQ of 1.0, Dali finds 42%-70% of possible homologs, whereas Matras finds 49%-57%; PSI-BLAST finds 36.9%. However, Dali achieves >84% coverage before the first error for half of the families tested. Dali and PSI-BLAST find 9.2% and 5.2%, respectively, of the 7056 possible topology pairs at an EPQ of 0.1 and 19.5, and 5.9% at an EPQ of 1.0. Most statistical significance estimates reported by the structural alignment programs overestimate the significance of an alignment by orders of magnitude when compared with the actual distribution of errors. These results help quantify the statistical distinction between analogous and homologous structures, and provide a benchmark for structure comparison statistics.


Figures

Figure 1.
Figure 1.
Errors per Query vs. Coverage plots for eight of the nine methods tested (PRIDE data not shown). (A) CATH Homolog set of true positives. (B) CATH Homolog set of true positives, but only non-Topologs are false positives. (C) CATH Topolog (same Topology) set of true positives, non-Topolog false positives. (D) Non-Homolog CATH Topolog set of true positives, non-Topolog false positives. The sequence alignment programs are shown with dashed lines; the structural comparison programs, with solid lines. Programs using Z-scores as the scoring criterion have open symbols; those using E()-values have filled symbols. Symbols are shown at every 200th point.
Figure 2.
Figure 2.
Errors per Query vs. Coverage plots for individual families. (A) The median level of coverage generated by the 86 queries is shown at a given number of errors (false positives) for CATH Homologs. (B) The same as A, except that the level of coverage is shown at the 25th percentile (with the families ranked by percent coverage). (C,D) The same as A and B, respectively, with CATH Topologs used as the set of true positives. The portions of the plot with EPQ <1 were made by grouping the families into groups of 10 by the length of the query (see Materials and Methods).
Figure 3.
Figure 3.
Errors per Query vs. Coverage plots for five independent query sets using the Structal method/LSQMAN program. (A) CATH Homologs and (B) CATH Topologs as the set of true positives. The data for the original set of queries is shown in bold.
Figure 4.
Figure 4.
Errors per Query vs. Coverage plots comparing statistical (E()-value or Z-score) scores vs. RMSD/Nalign for Structal, Dali, CE, VAST, and Matras. (A) Structal/LSQMAN, (B) Dali, (C) CE, (D) VAST, and (E) Matras. RMSD/Nalign is shown by dashed lines; E()-value (Structal/VAST) or Z-scores (Dali/CE/Matras), by solid lines. Homolog true positive set, open symbols; Topolog true positive set, closed symbols. The coverage for Homologs is shown on the lower x-axis; that for Topologs is shown on the upper x-axis.
Figure 5.
Figure 5.
The expected Poisson probability of seeing the reported E()-value vs. the observed probability when searching for (A) CATH Homologs and (B) CATH Topologs for LSQMAN/Structal, Dali, CE, VAST, Matras, SSEARCH, and PSI-BLAST. The E()-values for the highest-scoring false positive for each query are shown. Lines and symbols are as in Fig. 1 ▶, except that the Z-scores for Dali, CE, and Matras (open symbols) were converted into E()-values (see text for details). The numbers in parentheses refer to the number of data points that have y-values less than 0.001.

References

    1. Altschul, S.F. and Gish, W. 1996. Local alignment statistics. Methods Enzymol. 266 460–480. - PubMed
    1. Altschul, S.F., Madden, T.L., Schaffer, A.A., Zhang, J., Zhang, Z., Miller, W., and Lipman, D.J. 1997. Gapped BLAST and PSI-BLAST: A new generation of protein database search programs. Nucleic Acids Res. 25 3389–3402. - PMC - PubMed
    1. Berman, H.M., Westbrook, J., Feng, Z., Gilliland, G., Bhat, T.N., Weissig, H., Shindyalov, I.N., and Bourne, P.E. 2000. The Protein Data Bank. Nucleic Acids Res. 28 235–242. - PMC - PubMed
    1. Brenner, S.E. and Levitt, M. 2000. Expectations from structural genomics. Protein Sci. 9 197–200. - PMC - PubMed
    1. Brenner, S.E., Chothia, C., and Hubbard, T.J. 1998. Assessing sequence comparison methods with reliable structurally identified distant evolutionary relationships. Proc. Natl. Acad. Sci. 95 6073–6078. - PMC - PubMed

Publication types

MeSH terms