Comparative Study
. 2004 Mar;133(1):63-82.
doi: 10.1037/0096-3445.133.1.63.

Comparing categorization models

Affiliations
Comparative Study

Comparing categorization models

Jeffrey N Rouder et al. J Exp Psychol Gen. 2004 Mar.

Abstract

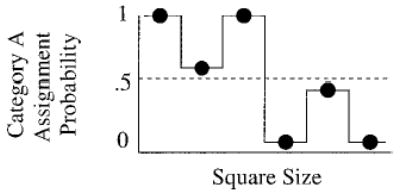
Four experiments are presented that competitively test rule- and exemplar-based models of human categorization behavior. Participants classified stimuli that varied on a unidimensional axis into 2 categories. The stimuli did not consistently belong to a category; instead, they were probabilistically assigned. By manipulating these assignment probabilities, it was possible to produce stimuli for which exemplar- and rule-based explanations made qualitatively different predictions. F. G. Ashby and J. T. Townsend's (1986) rule-based general recognition theory provided a better account of the data than R. M. Nosofsky's (1986) exemplar-based generalized context model in conditions in which the to-be-classified stimuli were relatively confusable. However, generalized context model provided a better account when the stimuli were relatively few and distinct. These findings are consistent with multiple process accounts of categorization and demonstrate that stimulus confusion is a determining factor as 10 which process mediates categorization.


Figures

Figure 1
Figure 1
A: Category structure and decision bound for Ratcliff and Rouder’s (1998) univariate design. B: Relative proportion of Category A exemplars for Ratcliff and Rouder’s design. C: Category structure and decision bound for Maddox and Ashby’s (1993) design. Categories were composed of bivariate normal distributions, which are represented as ellipses. D: Relative proportion of Category A exemplars for Maddox and Ashby’s design. Lighter areas correspond to higher proportions. E and F: Category structure, decision bounds, and relative proportion of Category A exemplars for McKinley and Nosofsky’s (1995) design. Categories were composed of mixtures of bivariate normal distributions; each component is represented with an ellipse. Panel A is from “Modeling Response Times for Decisions Between Two Choices,” by R. Ratcliff and J. N. Rouder, 1998, Psychological Science, 9, p. 350. Copyright 1998 by Blackwell Publishing. Adapted with permission. Panel C is from “Comparing Decision Bound and Exemplar Models of Categorization,” by W. T. Maddox and F. G. Ashby, 1993, Perception & Psychophysics, 53, p. 55. Copyright 1993 by the Psychonomic Society. Adapted with permission. Panel E is from “Investigations of Exemplar and Decision Bound Models in Large, Ill-Defined Category Structures,” by S. C. McKinley and R. M. Nosofsky, 1995, Journal of Experimental Psychology: Human Perception and Performance, 21, p. 135. Copyright 1995 by the American Psychological Association. Adapted with permission of the author.
Figure 2
Figure 2
A: Category assignment probabilities as a function of luminance. B: Typical rule-based predictions. C: Typical exemplar-based predictions.
Figure 3
Figure 3
Category A response proportions and model fits as a function of luminance for 6 participants in Experiment 1. The circles with error bars denote participants’ response proportions (error bars denote standard errors; see Footnote 1). The dashed lines denote generalized context model performance with the Absolute-Identification Scale (thick and thin lines denote performance for Gaussian and exponential gradients, respectively). The solid lines denote general recognition theory model performance (thick and thin lines denote performance for the Fixed-Variance Scale and Linear Scale, respectively). See text for a discussion of the data and predictions for Participant L.T.
Figure 4
Figure 4
A general recognition theory model for absolute identification. The perceived luminance scale is partitioned into regions corresponding to the eight different stimuli.’
Figure 5
Figure 5
The relationship between stimulus confusion and categorization response patterns.
Figure 6
Figure 6
The category assignment probabilities for Experiment 2.
Figure 7
Figure 7
The types of response patterns observed in Experiment 2. Each panel shows response proportions and model predictions for selected participants. Circles with error bars denote response proportions and standard errors, respectively. The solid lines denote predictions from a general recognition theory model with the Linear Scale. The dashed lines denote predictions from a generalized context model with the Gaussian similarity gradient and the Absolute-Identification Scale.
Figure 8
Figure 8
Cumulative distribution functions of the natural logarithm of chi-square fit statistics for square-size increment conditions of 5 and 15 in Experiment 2. The cumulative probability is obtained by ordering participants’ chi-square fit statistics. The three thick lines denote general recognition theory (GRT) model fits; the four thin lines denote generalized context model (GCM) fits.
Figure 9
Figure 9
Category assignment probabilities for Experiment 3.
Figure 10
Figure 10
Category A response proportions and model fits as a function of square size for 6 participants in Experiment 3. The circles with error bars denote participants’ response proportions (error bars denote standard errors; see Footnote 1). The solid lines denote predictions from a general recognition theory model with the Linear Scale. The dashed lines denote predictions from a generalized context model with the Gaussian similarity gradient and the Linear Scale.
Figure 11
Figure 11
Category assignment probabilities for Experiment 4.
Figure 12
Figure 12
Results from Experiment 4. Data are means over all participants. Error bars denote standard errors and were calculated across participants.
Figure 13
Figure 13
Response proportions and model predictions for the 9 participants in the control condition of Experiment 4. Circles with error bars denote response proportions and standard errors (see Footnote 1), respectively. The solid lines denote predictions from a general recognition theory model with the Linear Scale. The dashed lines denote predictions from a generalized context model with the Gaussian similarity gradient and the Linear Scale.
Figure 14
Figure 14
Response proportions and model predictions for the 12 participants in the experimental condition of Experiment 4. Circles with error bars denote response proportions and standard errors (see Footnote 1), respectively. Solid and dashed lines denote general recognition theory (GRT) and generalized context model (GCM) predictions, respectively. The solid lines denote predictions from a GRT model with the Linear Scale. The dashed lines denote predictions from a GCM model with the Gaussian similarity gradient and the Linear Scale.
Figure 15
Figure 15
Cumulative distribution functions of chi-square fit statistics for control and experimental conditions in Experiment 4. The cumulative probability is obtained by ordering participants’ chi-square fit statistics. The thick solid lines denote the values from the general recognition theory (GRT) model with the Linear Scale. The thin lines denote the values from the exponential and Gaussian gradient generalized context model (GCM) (both with the Linear Scale).

References

    1. Ashby FG. A stochastic version of general recognition theory. Journal of Mathematical Psychology. 2000;44:310–329. - PubMed
    1. Ashby FG, Alfonso-Reese LA. Categorization as probability density estimation. Journal of Mathematical Psychology. 1995;39:216–233.
    1. Ashby FG, Alfonso-Reese LA, Turken AU, Waldron EM. A neuropsychological theory of multiple systems in category learning. Psychological Review. 1998;105:442–481. - PubMed
    1. Ashby FG, Ell SW. The neurobiology of human category learning. Trends in Cognitive Sciences. 2001;5:204–210. - PubMed
    1. Ashby, F. G., & Ell, S. W. (2002). Single versus multiple systems of learning and memory. In H. Pashler & J. Wixted (Eds.), Stevens’ handbook of experimental psychology: Vol. 4. Methodology in experimental psychology (3rd ed., pp. 655–691). New York: Wiley.

Publication types

LinkOut - more resources