

Comparison of different MRI brain atrophy rate measures with clinical disease progression in AD
- PMID: 14981176
- PMCID: PMC2730165
- DOI: 10.1212/01.wnl.0000110315.26026.ef
Comparison of different MRI brain atrophy rate measures with clinical disease progression in AD
Abstract
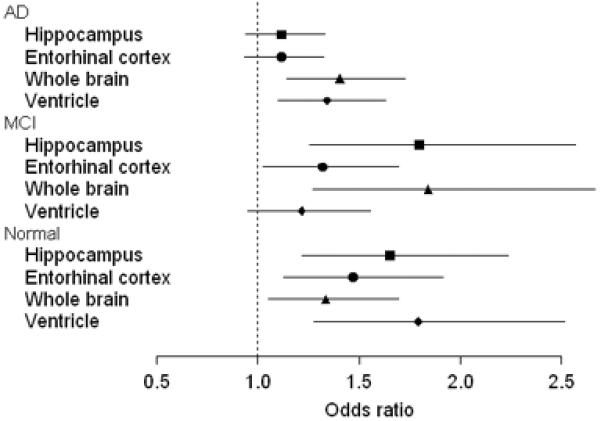
Objective: To correlate different methods of measuring rates of brain atrophy from serial MRI with corresponding clinical change in normal elderly subjects, patients with mild cognitive impairment (MCI), and patients with probable Alzheimer disease (AD).
Methods: One hundred sixty subjects were recruited from the Mayo Clinic Alzheimer's Disease Research Center and Alzheimer's Disease Patient Registry Studies. At baseline, 55 subjects were cognitively normal, 41 met criteria for MCI, and 64 met criteria for AD. Each subject underwent an MRI examination of the brain at the time of the baseline clinical assessment and then again at the time of a follow-up clinical assessment, 1 to 5 years later. The annualized changes in volume of four structures were measured from the serial MRI studies: hippocampus, entorhinal cortex, whole brain, and ventricle. Rates of change on several cognitive tests/rating scales were also assessed. Subjects who were classified as normal or MCI at baseline could either remain stable or convert to a lower-functioning group. AD subjects were dichotomized into slow vs fast progressors.
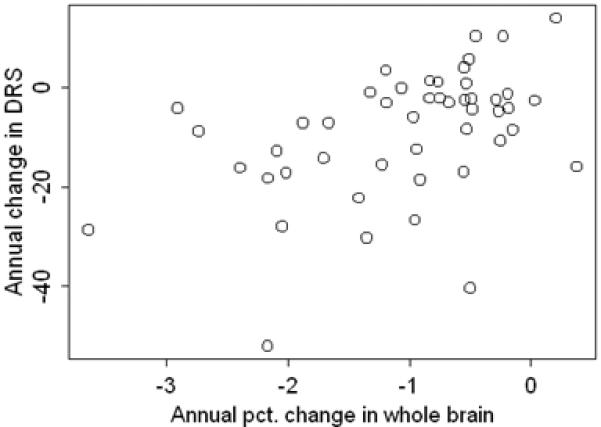
Results: All four atrophy rates were greater among normal subjects who converted to MCI or AD than among those who remained stable, greater among MCI subjects who converted to AD than among those who remained stable, and greater among fast than slow AD progressors. In general, atrophy on MRI was detected more consistently than decline on specific cognitive tests/rating scales. With one exception, no differences were found among the four MRI rate measures in the strength of the correlation with clinical deterioration at different stages of the disease.
Conclusions: These data support the use of rates of change from serial MRI studies in addition to standard clinical/psychometric measures as surrogate markers of disease progression in AD. Estimated sample sizes required to power a therapeutic trial in MCI were an order of magnitude less for MRI than for change measures based on cognitive tests/rating scales.
Figures


References
-
- Fox NC, Freeborough PA. Brain atrophy progression measured from registered serial MRI: validation and application to Alzheimer's disease. Journal of Magnetic Resonance Imaging. 1997;7:1069–75. - PubMed
-
- Fox NC, Cousens S, Scahill R, et al. Using serial registered brain magnetic resonance imaging to measure disease progression in Alzheimer disease. Arch Neurol. 2000;57:339–443. - PubMed
-
- Fox NC, Scahill RI, Crum WR, et al. Correlation between rates of brain atrophy and cognitive decline in AD. Neurology. 1999;52:1687–1689. - PubMed
Publication types
MeSH terms
Substances
Grants and funding
LinkOut - more resources
Full Text Sources
Other Literature Sources
Medical
Miscellaneous