. 2004 Mar 2;101(9):3059-64.
doi: 10.1073/pnas.0308746101. Epub 2004 Feb 23.

NGEP, a gene encoding a membrane protein detected only in prostate cancer and normal prostate

Affiliations

NGEP, a gene encoding a membrane protein detected only in prostate cancer and normal prostate

Tapan K Bera et al. Proc Natl Acad Sci U S A. .

Abstract

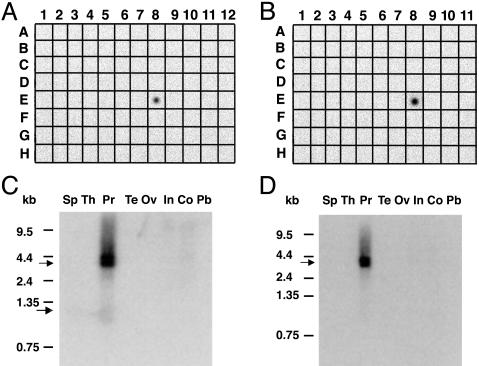
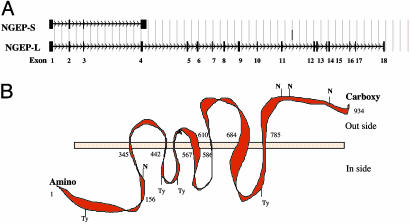
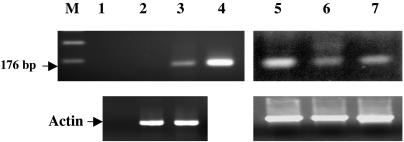
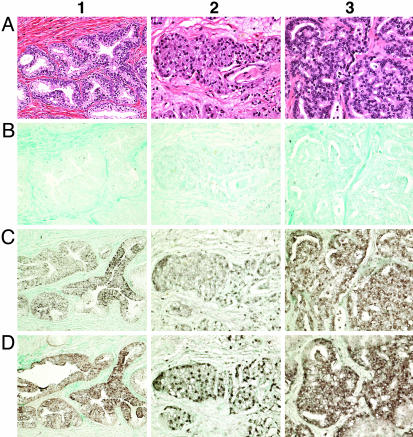
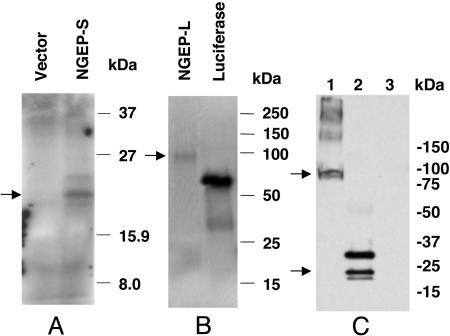
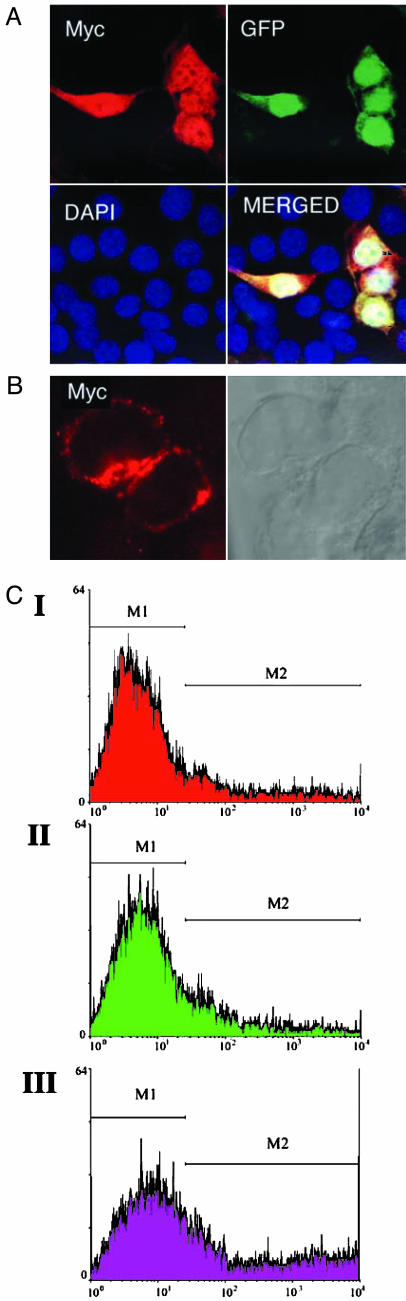
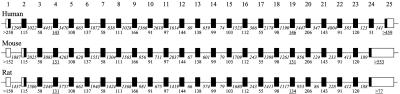
We identified a gene (NGEP) that is expressed only in prostate cancer and normal prostate. The two NGEP transcripts are 0.9 kb and 3.5 kb in size and are generated by a differential splicing event. The short variant (NGEP-S) is derived from four exons and encodes a 20-kDa intracellular protein. The long form (NGEP-L) is derived from 18 exons and encodes a 95-kDa protein that is predicted to contain seven-membrane-spanning regions. In situ hybridization shows that NGEP mRNA is localized in epithelial cells of normal prostate and prostate cancers. Immunocytochemical analysis of cells transfected with NGEP cDNAs containing a Myc epitope tag at the carboxyl terminus shows that the protein encoded by the short transcript is localized in the cytoplasm, whereas the protein encoded by the long transcript is present on the plasma membrane. Because of its selective expression in prostate cancer and its presence on the cell surface, NGEP-L is a promising target for the antibody-based therapies of prostate cancer.


Figures

Fig. 1.
Fig. 1.
Tissue-specific expression of NGEP mRNA. (A and B) RNA hybridization of a multiple tissue dot-blot containing mRNA from 61 normal human cell types or tissues using NGEP-S (A) and NGEP-L (B) cDNA as probe. NGEP expression is observed only in prostate (E8). There is no detectable expression in brain (A1), heart (A4), lung (A8), kidney (A7), and pancreas (B9). (C and D) Northern blot analysis of NGEP in different normal tissues using NGEP-S (C) and NGEP-L (D) cDNA as probe. The short transcript (shown by an arrow) is ≈1.0 kb in size and the long transcript (shown by an arrow) is 3.5 kb in size and is expressed only in prostate.
Fig. 2.
Fig. 2.
Schematics describing the NGEP gene and the proteins it encodes. (A) Genomic organization of NGEP gene. There are 18 exons for the long transcript and four exons for the short transcript (filled boxes). (B) Predicted topology of the protein encoded by the NGEP-L transcript. There are seven predicted membrane spanning regions; the amino terminus is predicted to be inside, and the carboxyl terminus is predicted to be outside of the cell. There are several predicted tyrosine phosphorylation sites (Ty) and N-glycosylation sites (N) in this protein.
Fig. 3.
Fig. 3.
RT-PCR analysis of RNAs from prostate cancer specimens and prostate cancer cell lines. M, molecular mass standard; lane 1, negative control; lane 2, PC-3, lane 3, LNCaP; lane 4, pNGEP plasmid positive control; and lanes 5-7, prostate cancer samples. The quality of the cDNA was evaluated by performing PCR using primers specific for actin.
Fig. 4.
Fig. 4.
In situ localization of NGEP mRNA in prostate tissue. (A) Normal prostate (column 1) and prostate cancer (columns 2 and 3) sections stained with hematoxylin/eosin to show the morphology. The epithelial cells are stained blue, whereas the connective tissue is stained pink. (B) B lymphocyte-specific gene CD22 used as a negative control probe for in situ hybridization. Note the absence of signal in the epithelial cells. (C) U6 is a small nuclear RNA used as a positive control probe. The epithelial cells show a strong signal. (D) NGEP shows positive signals in the epithelial cells of normal prostate tissue (column 1) as well as in two adenocarcinomas (columns 2 and 3).
Fig. 5.
Fig. 5.
Analysis of the protein products encoded by NGEP. (A and B) In vitro translation of the NGEP-S (A) and NGEP-L (B) cDNAs. The expected 20-kDa protein product is detected in lane NGEP-S, and a 100-kDa product is detected in lane NGEP-L by using short- and long-form cDNAs, respectively (shown by arrows). Lane with vector DNA alone showed no detectable bands, and the positive control luciferase shows the expected 62-kDa band. (C) Western blot analysis of NGEP-transfected cell extracts with an anti-Myc-tag antibody. The expected 100-kDa protein is detected (shown by an arrow) in extracts transfected with pNGEP-L-Myc (lane 1). Three specific bands (18, 20, and 28 kDa) are detected in cell extracts transfected with plasmid pNGEP-S-Myc (lane 2). A cell extract from vector only transfected cells and produced no signal.
Fig. 6.
Fig. 6.
Localization of NGEP protein in tranfected cells. (A and B) Immunocytochemical analysis of NGEP localization in transfected cells. Immunocytochemistry using anti-Myc antibody was done under confocal microscopy in 293T cells cotransfected with pEGFP and pNGEP-S-Myc. The red signals representing NGEP-S expression were detected in both the cytoplasm and the nucleus (A). In cells transfected with pNGEP-L-Myc, positive red signals were localized on the plasma membrane when nonpermeabilized conditions were used for immunostaining (B). (C) FACS analysis of NGEP-S and NGEP-L form. Single parameter histograms for the gated cells for nontransfected (red), NGEP-S (green), and NGEP-L (purple) are shown. Cells were incubated with the anti-myc mouse antibody (20 μg/ml), followed by phycoerythrin-labeled goat anti-mouse IgG. The marker M1, placed around the negative peak of the subclass control is determined by using nontransfected 293T cells. The marker M2 is placed to the right of M1 to designate the positive events. M2's are 20%, 22%, and 40% for nontransfected, 293T cells-NGEP-S, and 293T cells NGEP-L, respectively.
Fig. 7.
Fig. 7.
Analysis of the NGEP-L orthologs in mouse and rat. Schematics showing genomic organization of NGEP-L and its rodent orthologs. Exon numbers are given at the top. The size of each exon and intron is noted below the corresponding exon or intron. The exons with different sizes among the species are underlined. The figure is not drawn to scale.

References

    1. Bostwick, D. G., MacLennan, G. T. & Larson, T. R., eds. (1999) Prostate Cancer: What Every Man and His Family Needs to Know (Villard, New York), Revised Ed.
    1. Hara, T., Harada, N., Mitsui, H., Miura, T., Ishizaka, T. & Miyajima, A. (1994) Blood 84, 189-199. - PubMed
    1. Liang, P. & Pardee, A. B. (1992) Science 257, 967-971. - PubMed
    1. Velculescu, V. E., Zhang, L., Vogelstein, B. & Kinzler, K. W. (1995) Science 276, 1268-1272. - PubMed
    1. Schena, M., Shalon, D., Davis, R. W. & Brown, P. O. (1995) Science 270, 467-470. - PubMed

MeSH terms