Quantitative analysis of myocardial inflammation by flow cytometry in murine autoimmune myocarditis: correlation with cardiac function
- PMID: 14982835
- PMCID: PMC1613271
- DOI: 10.1016/S0002-9440(10)63169-0
Quantitative analysis of myocardial inflammation by flow cytometry in murine autoimmune myocarditis: correlation with cardiac function
Abstract
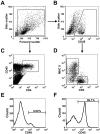
Inflammation has been increasingly recognized as an important pathological component of heart failure. Existing methods of assessing myocardial infiltrate are labor-intensive and provide data that are difficult to quantify and not representative of the whole heart. As a result, little effort has been made to systematically assess the components of myocardial inflammation. We established an alternative method of quantitative assessment of myocardial inflammation by flow cytometry after enzymatic digestion of hearts to characterize the infiltrate and study the association between inflammation and cardiac function in murine experimental autoimmune myocarditis. The severity of acute myocarditis uniquely correlated with the proportion of neutrophils, but not T cells, B cells, or macrophages. Both acute and chronic phases were characterized by the presence of CD44high (activated) T cells in the heart, whereas T cells trafficking through normal hearts exhibited CD44low phenotype. During the chronic phase, the proportion of CD4+ T cells was associated with increased left-ventricular volumes and deterioration of systolic function, the hallmarks of dilated cardiomyopathy. We conclude that flow cytometry on uniformly digested mouse hearts provides sensitive and reproducible assessment of myocardial infiltrate and can be used to dissect out the specific role of individual immune components from the overall inflammatory response in the heart.
Figures


Similar articles
-
Chronic myocarditis induced by T cells reactive to a single cardiac myosin peptide: persistent inflammation, cardiac dilatation, myocardial scarring and continuous myocyte apoptosis.J Autoimmun. 2000 Nov;15(3):359-67. doi: 10.1006/jaut.2000.0432. J Autoimmun. 2000. PMID: 11040076
-
Autoimmune myocarditis: cellular mediators of cardiac dysfunction.Autoimmun Rev. 2004 Nov;3(7-8):476-86. doi: 10.1016/j.autrev.2004.08.009. Autoimmun Rev. 2004. PMID: 15546794 Review.
-
Cardiosphere-Derived Cells Attenuate Inflammation, Preserve Systolic Function, and Prevent Adverse Remodeling in Rat Hearts With Experimental Autoimmune Myocarditis.J Cardiovasc Pharmacol Ther. 2019 Jan;24(1):70-77. doi: 10.1177/1074248418784287. Epub 2018 Jul 30. J Cardiovasc Pharmacol Ther. 2019. PMID: 30060693
-
Adiponectin deficiency has no effect in murine autoimmune myocarditis.Cytokine. 2019 Apr;116:139-149. doi: 10.1016/j.cyto.2018.12.022. Epub 2019 Feb 1. Cytokine. 2019. PMID: 30716658
-
Pathogenesis of myocarditis and dilated cardiomyopathy.Adv Immunol. 2008;99:95-114. doi: 10.1016/S0065-2776(08)00604-4. Adv Immunol. 2008. PMID: 19117533 Review.
Cited by
-
Endogenous memory CD8 T cells directly mediate cardiac allograft rejection.Am J Transplant. 2014 Mar;14(3):568-79. doi: 10.1111/ajt.12605. Epub 2014 Feb 6. Am J Transplant. 2014. PMID: 24502272 Free PMC article.
-
Immunopathogenesis and immunomodulatory therapy for myocarditis.Sci China Life Sci. 2023 Sep;66(9):2112-2137. doi: 10.1007/s11427-022-2273-3. Epub 2023 Mar 29. Sci China Life Sci. 2023. PMID: 37002488 Free PMC article. Review.
-
Heterozygous interferon signaling deficient mice as animal models for Chikungunya virus infection in the heart.Sci Rep. 2025 May 23;15(1):18022. doi: 10.1038/s41598-025-02191-9. Sci Rep. 2025. PMID: 40410198 Free PMC article.
-
CXC chemokine ligand (CXCL) 9 and CXCL10 are antagonistic costimulation molecules during the priming of alloreactive T cell effectors.J Immunol. 2010 Apr 1;184(7):3450-60. doi: 10.4049/jimmunol.0903831. Epub 2010 Mar 1. J Immunol. 2010. PMID: 20194716 Free PMC article.
-
Rapid quantification of inflammation in tissue samples using perfluorocarbon emulsion and fluorine-19 nuclear magnetic resonance.Biotechniques. 2011 Apr;50(4):229-34. doi: 10.2144/000113652. Biotechniques. 2011. PMID: 21548906 Free PMC article.
References
-
- Wolfgram LJ, Beisel KW, Herskowitz A, Rose NR. Variations in the susceptibility to coxsackievirus B3-induced myocarditis among different strains of mice. J Immunol. 1986;136:1846–1852. - PubMed
-
- Hill SL, Afanasyeva M, Rose NR. Autoimmune myocarditis. Bona CA, Theophilopoulos AN, editors. Ann Arbor: Taylor & Francis,; The Molecular Pathology of Autoimmune Diseases. 2002:pp 951–964.
-
- Gauntt C, Huber S. Coxsackievirus experimental heart diseases. Front Biosci. 2003;8:E23–E35. - PubMed
-
- Fairweather D, Kaya Z, Shellam GR, Lawson CM, Rose NR. From infection to autoimmunity. J Autoimmun. 2001;16:175–186. - PubMed
-
- Kawai C. From myocarditis to cardiomyopathy: mechanisms of inflammation and cell death: learning from the past for the future. Circulation. 1999;99:1091–1100. - PubMed
Publication types
MeSH terms
Substances
Grants and funding
LinkOut - more resources
Full Text Sources
Other Literature Sources
Medical
Research Materials

